Curved Roadmap Infographic with Key Points

Product Description
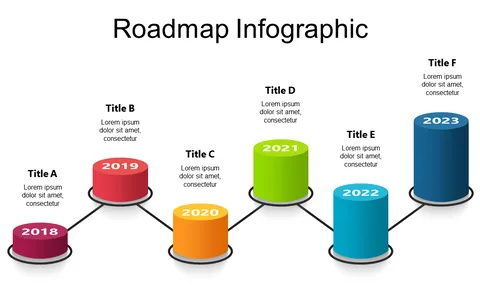
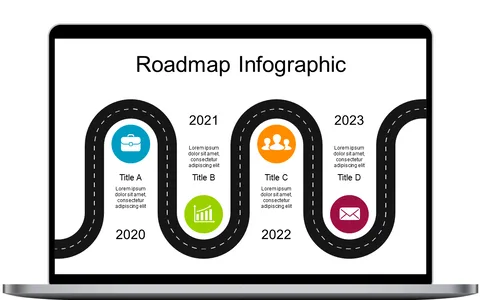
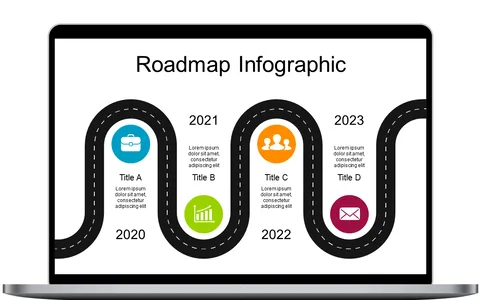
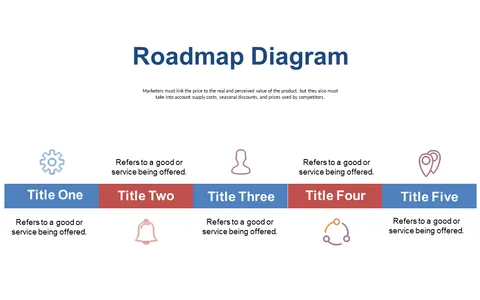
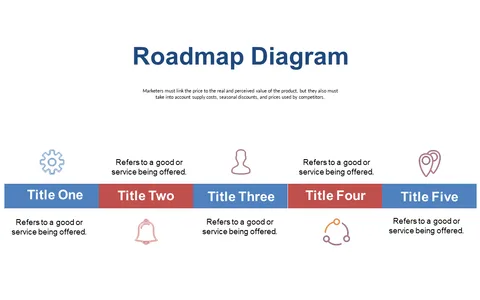
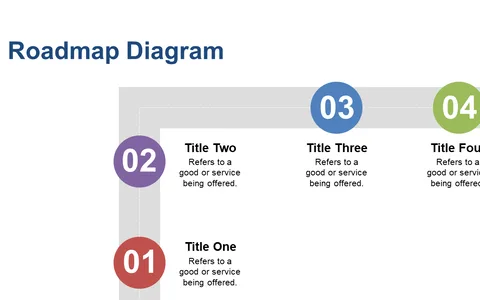
In a fast-paced business world, clearly presenting your project timeline can feel daunting. This curved roadmap infographic is designed to assist you in showcasing critical milestones and key points, making it easy for your audience to visualize the project’s journey.
It enhances understanding and keeps everyone informed. This slide is particularly useful for project leaders outlining long-term objectives or marketing teams illustrating campaign timelines. Use it in client presentations or team updates to provide clarity on where the project stands and where it’s headed.
For just $0.99, you can download this infographic immediately and edit it in PowerPoint or Google Slides. Customize it to fit your project and have a polished presentation ready in no time.
$0.99 – Purchase Checkout
Added to cart