Clarify Roles in Decision-Making with RAPID Chart

Product Description
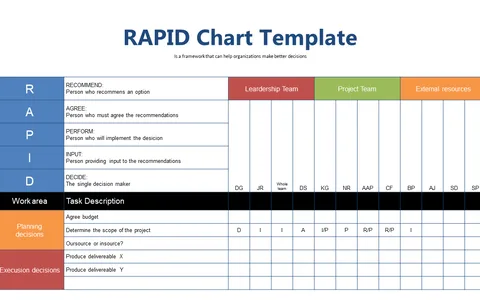
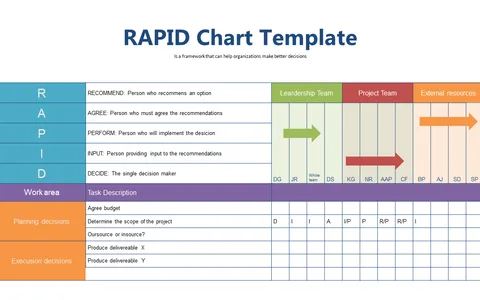
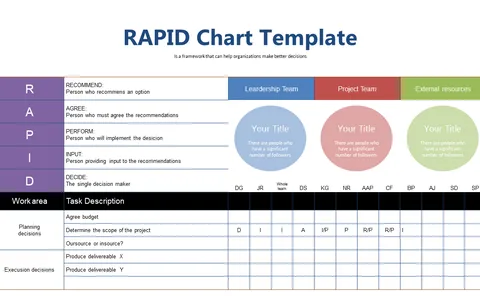
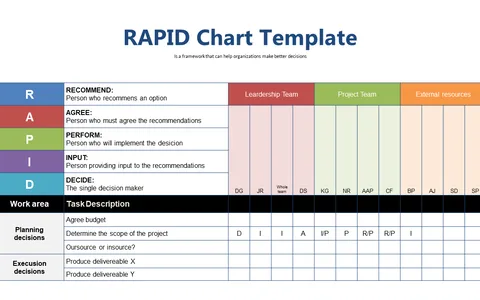
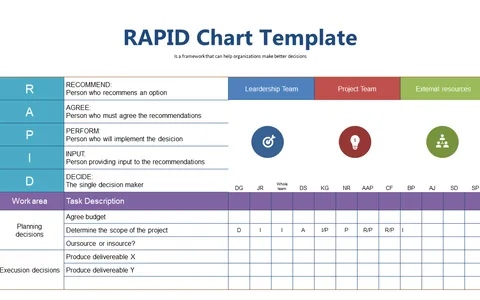
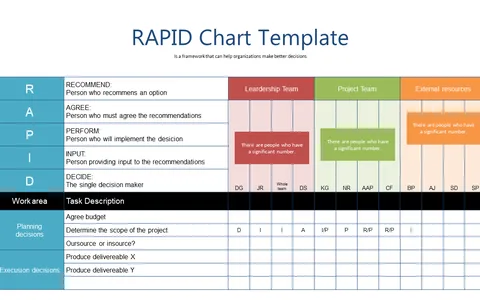
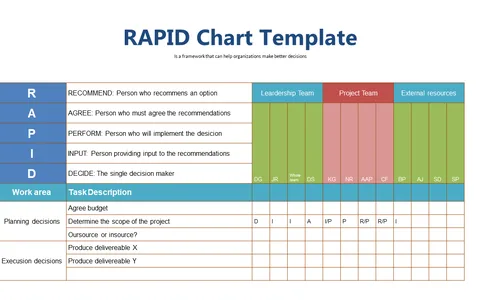
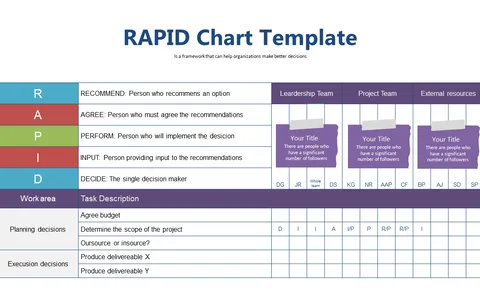
Decision-making can quickly become muddled when team roles are not distinctly outlined, leading to frustration and inefficiency. This slide helps clear up those uncertainties by presenting a RAPID chart that visually separates responsibilities in the decision-making process.
With this clarity, you can ensure everyone knows their role, allowing for a smoother workflow. This slide is perfect for team leaders, product managers, and operations directors who find themselves in situations where decision roles are often unclear. Whether you’re running a product development meeting or a quarterly strategy session, this chart ensures that your team understands who is recommending, agreeing, performing, and providing input.
For just $0.99, you can download this slide and have it ready for your next meeting. It’s fully editable in PowerPoint and Google Slides, making customization a breeze, so you can have it prepared in minutes.
$0.99 – Purchase Checkout
Added to cart