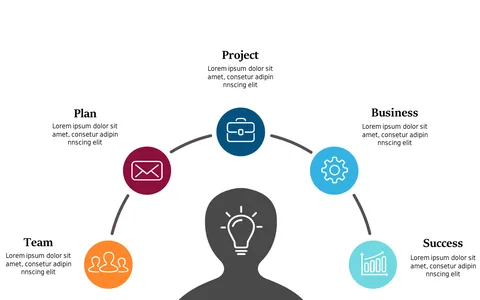
Editable 5-Step Project Management Process Layout

Product Description
Keeping track of the multiple phases in a project can often feel chaotic, especially when you’re juggling various tasks. This slide simplifies the process by offering a clean, editable 5-step layout that visually organizes each aspect of project management.
Whether you’re a project coordinator in healthcare, an operations manager in manufacturing, or a consultant leading a client project, this slide is perfect for project planning sessions and team briefings. It provides clarity to ensure that everyone is aligned on the next steps.
Available for only $0.99, this slide can be downloaded immediately and customized in both PowerPoint and Google Slides. Edit it to meet your project’s unique requirements and save valuable time in your presentations.
$0.99 – Purchase Checkout
Added to cart