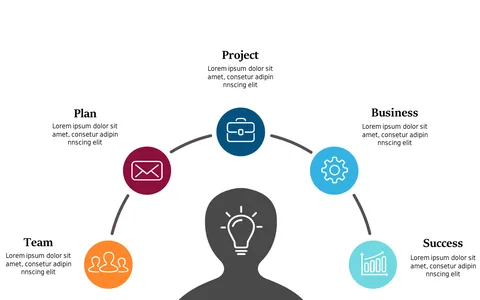
Quadrant Layout for Project Management Insights
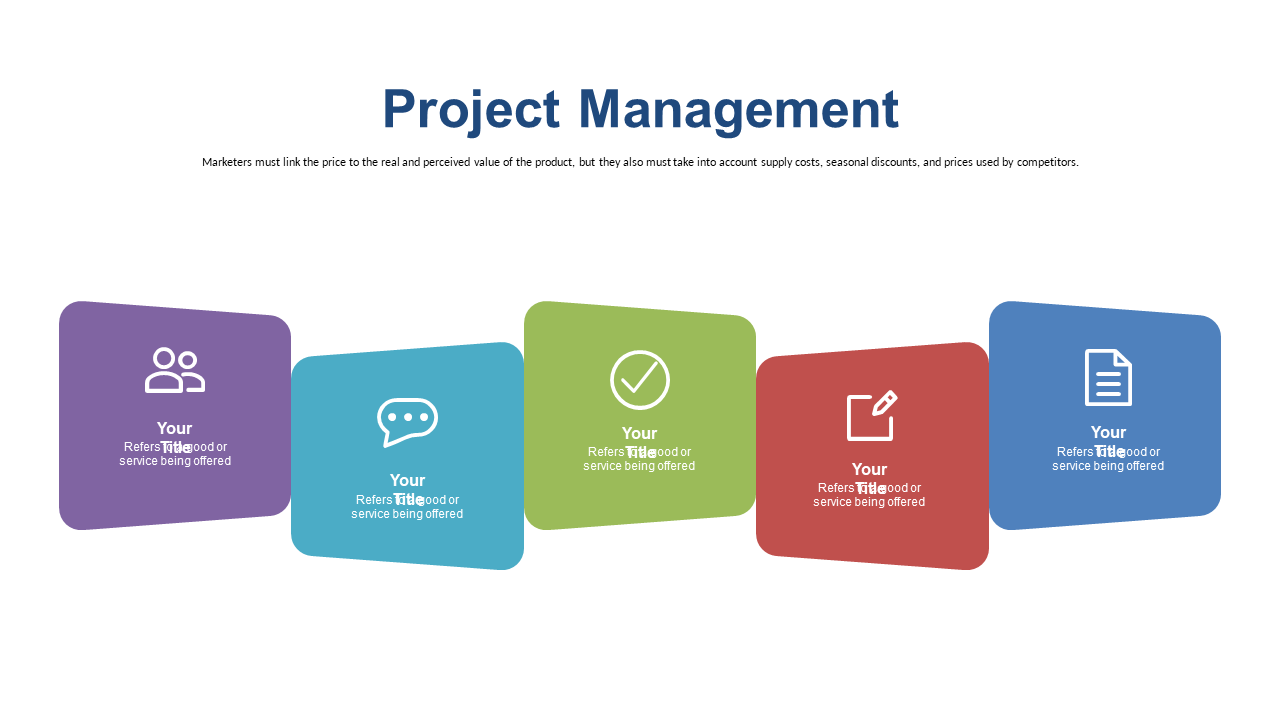
Product Description
Every team lead understands the struggle of making complex project updates clear and engaging. This quadrant layout organizes your information visually, helping you keep your audience focused on the most critical project management insights.
Perfect for project managers, department heads, and business consultants during client presentations or internal updates, this slide allows you to highlight key performance indicators, timelines, or resource allocations effectively. It’s designed to make your updates not just informative but also visually appealing.
Available for just $0.99, this slide can be downloaded instantly and edited in PowerPoint or Google Slides. Customize it easily to fit your project’s unique needs within minutes.
$0.99 – Purchase Checkout
Added to cart