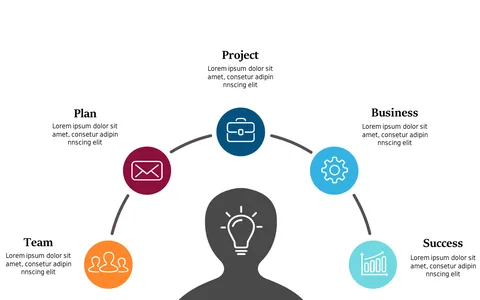
Cyclic Diagram for Project Life Cycle Phases
Product Description
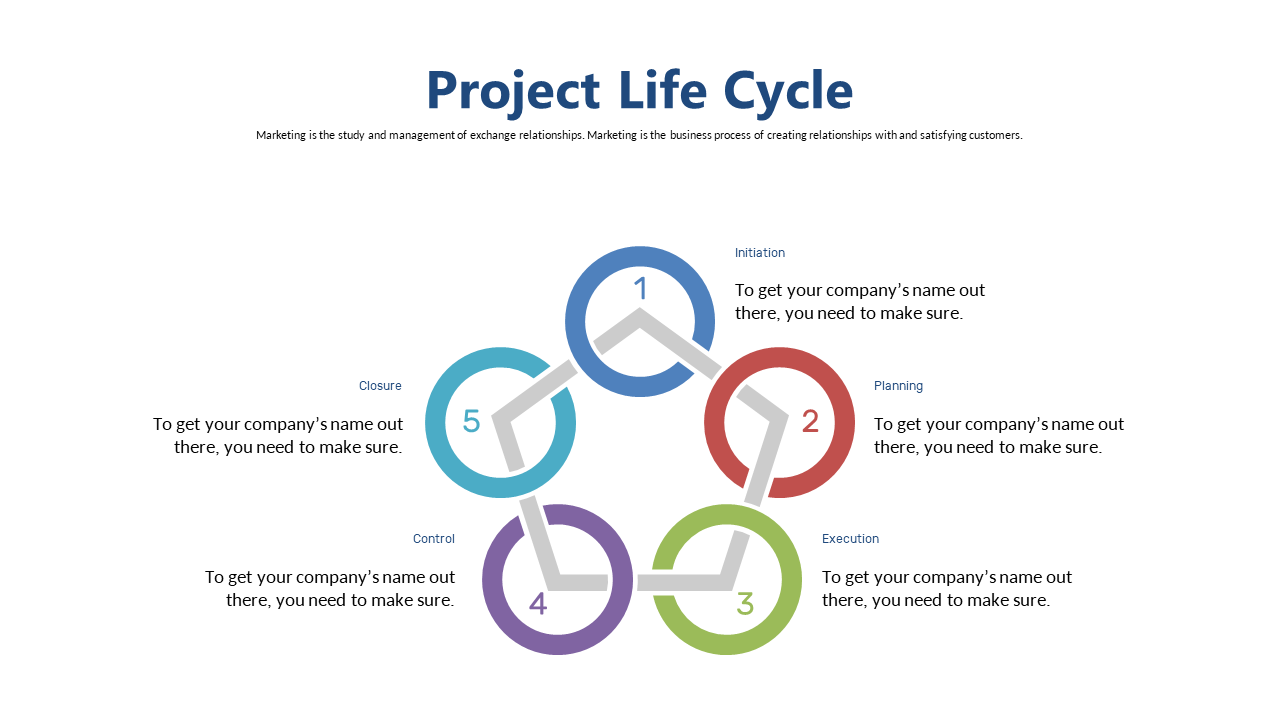
In fast-paced project environments, conveying complex information succinctly is essential. This cyclic diagram for project life cycle phases breaks down the process into simple, digestible stages: Initiation, Planning, Execution, Control, and Closure.
It removes ambiguity and clarifies the project trajectory for all involved. This slide is an excellent resource for project managers, business analysts, and consultants during project reviews, strategic meetings, or progress assessments. Whether you’re in IT, marketing, or construction, it’s designed to facilitate clear communication of project phases to diverse audiences.
Grab this slide today for just $0.99, and you’ll receive an instant download that’s fully editable in both PowerPoint and Google Slides. Simplifying your project presentations has never been easier.
$0.99 – Purchase Checkout
Added to cart