Gantt Chart for Effective Task Management
Product Description
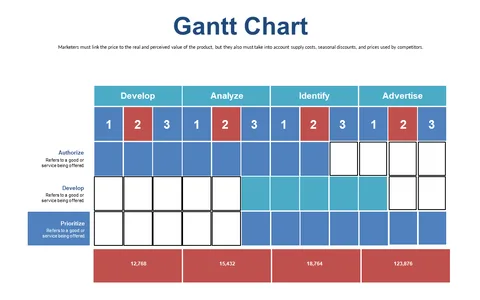
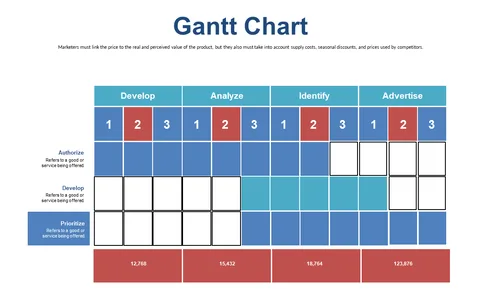
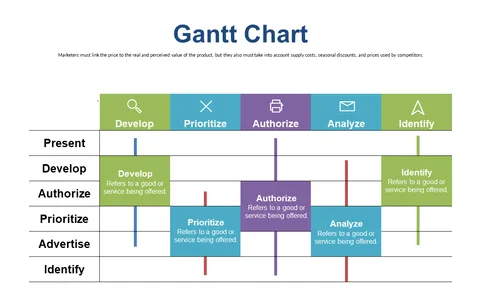
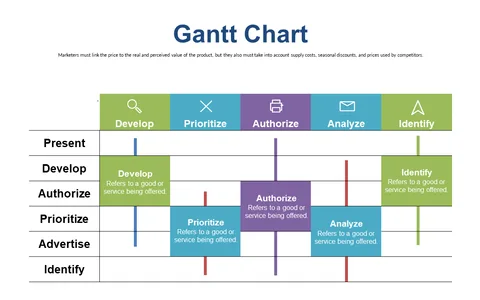
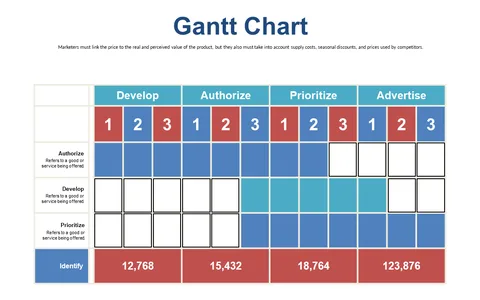
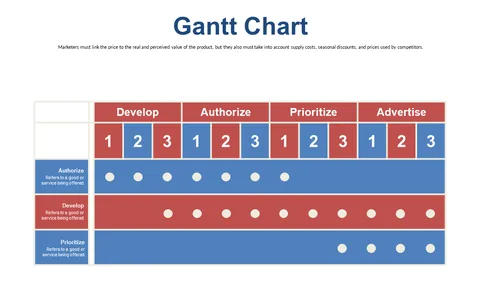
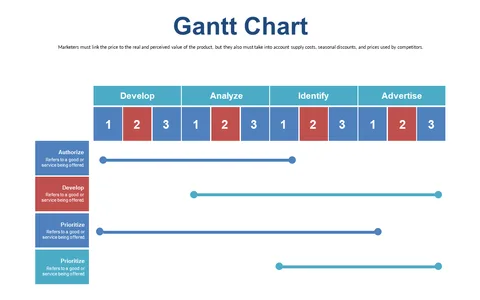
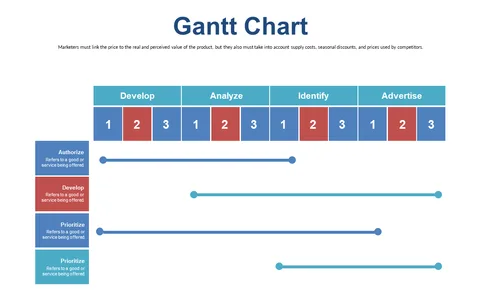
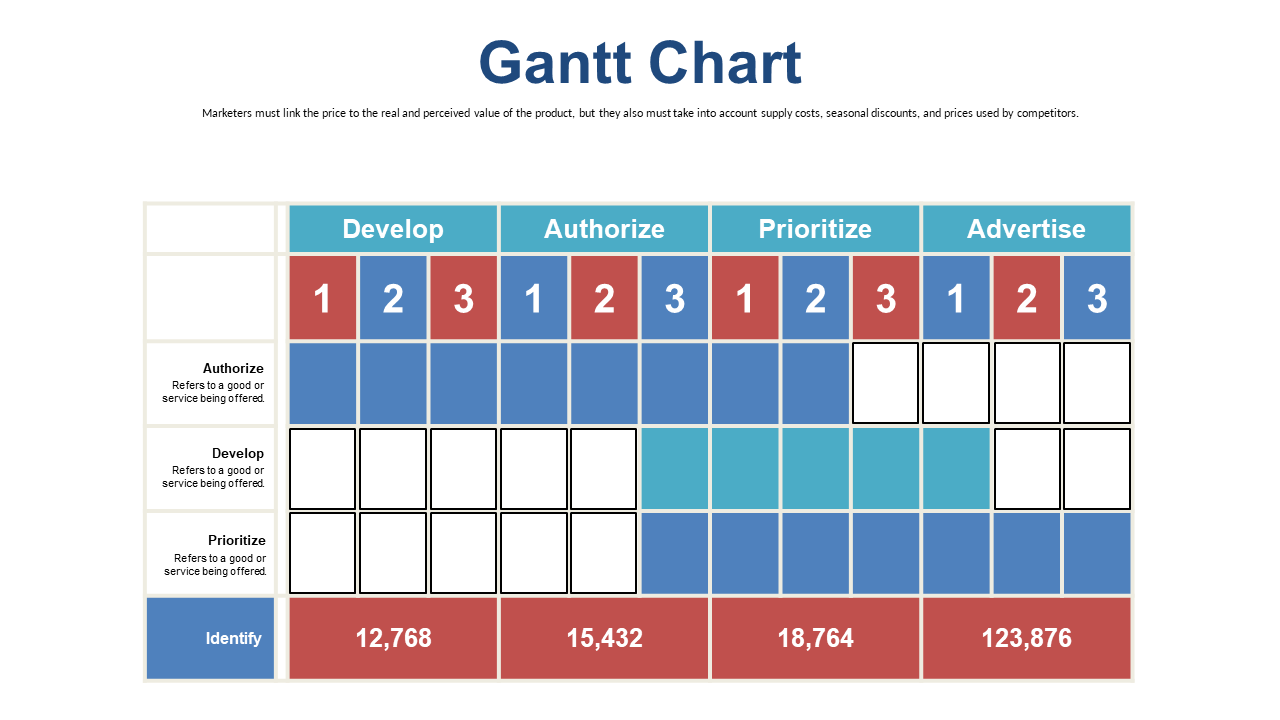
Keeping track of multiple project timelines can feel daunting, especially as deadlines loom closer. You need a solution that helps you visualize all tasks in a straightforward manner without the chaos. This Gantt Chart slide simplifies project management by presenting your tasks in a clear timeline format, allowing you to focus on what needs to be done next.
Project managers, team leads, and even event coordinators will find this slide invaluable during status meetings or project kick-offs. When you need to show progress to clients or align your team on upcoming deadlines, this Gantt Chart serves as the perfect visual aid.
Its organized layout helps everyone quickly grasp where things stand and what’s on the horizon. For just $0.99, you can easily download this slide and customize it in PowerPoint or Google Slides. Editing is a breeze, so you can have it ready for your next meeting in no time.
$0.99 – Purchase Checkout
Added to cart