Gantt Chart for Milestones and Task Tracking
Product Description
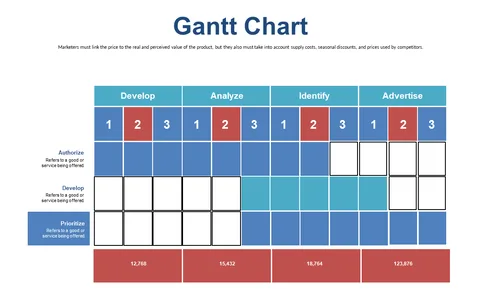
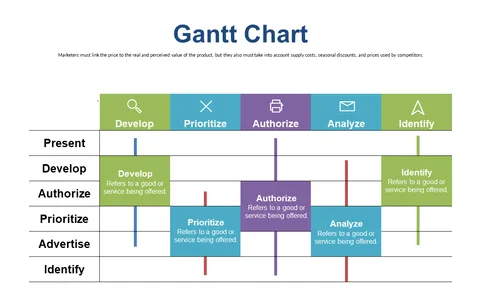
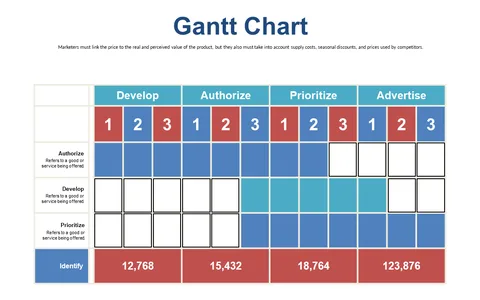
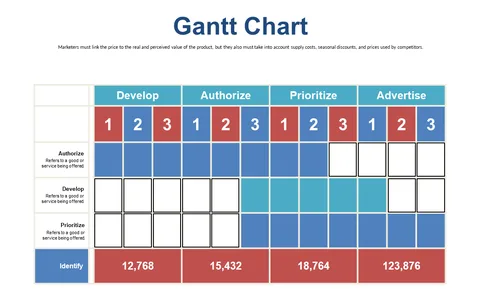
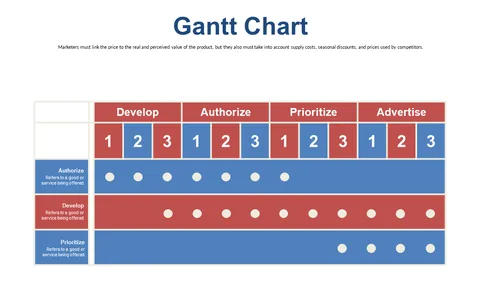
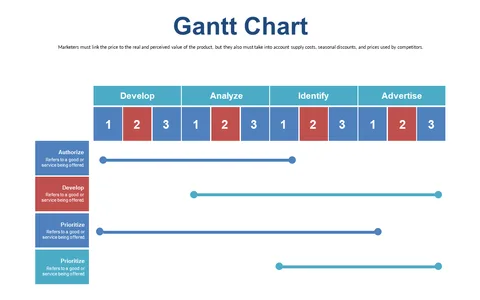
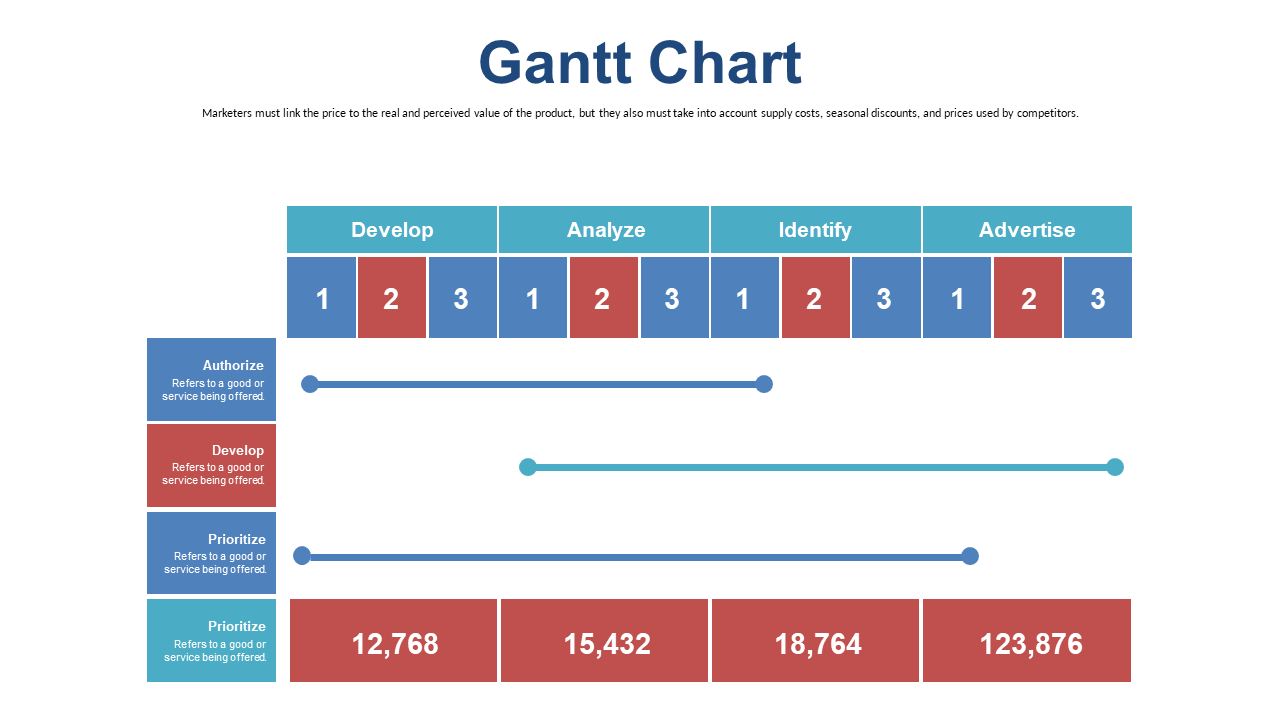
Keeping track of timelines while managing multiple projects can quickly become overwhelming. This Gantt Chart slide provides a straightforward layout that highlights milestones and task allocations, making it easier for you to maintain clarity and focus.
It’s a great tool to ensure that nothing falls through the cracks. This slide is ideal for operations managers needing to update team members on various ongoing projects or for event coordinators detailing timelines for different activities. It’s also useful for business analysts presenting project updates to leadership teams, providing a visual guide that everyone can understand.
You can grab this slide for just $0.99 and download it instantly. It’s fully editable in PowerPoint and Google Slides, allowing you to customize details like task durations and associated costs without any hassle.
$0.99 – Purchase Checkout
Added to cart