Track Project Tasks with Editable Gantt Chart
Product Description
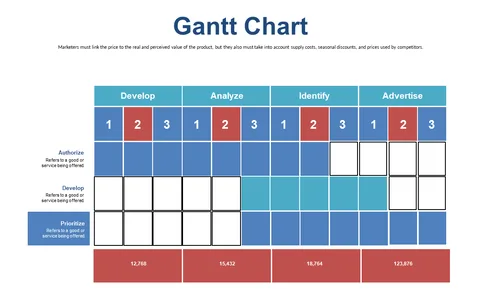
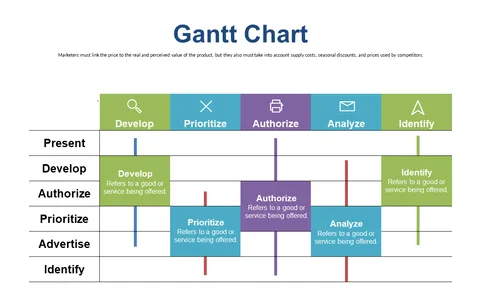
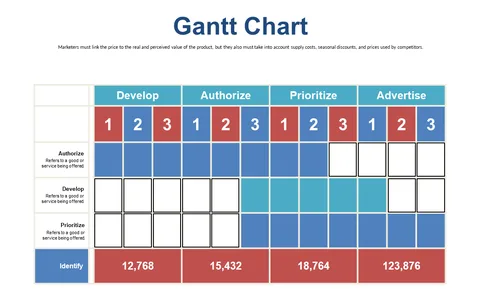
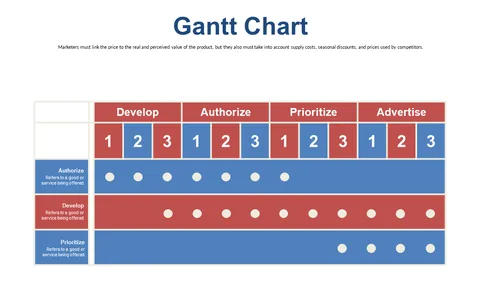
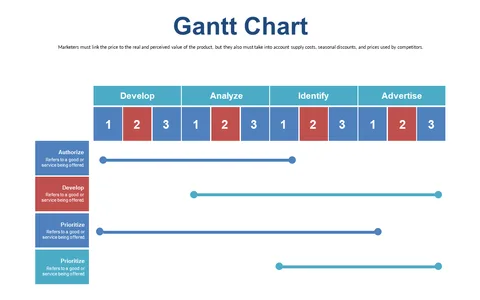
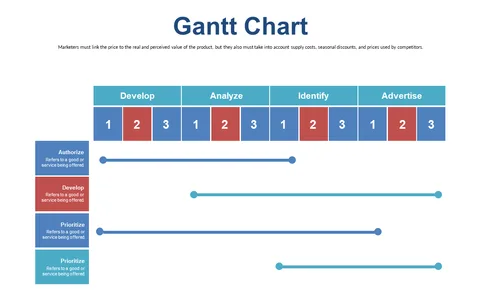
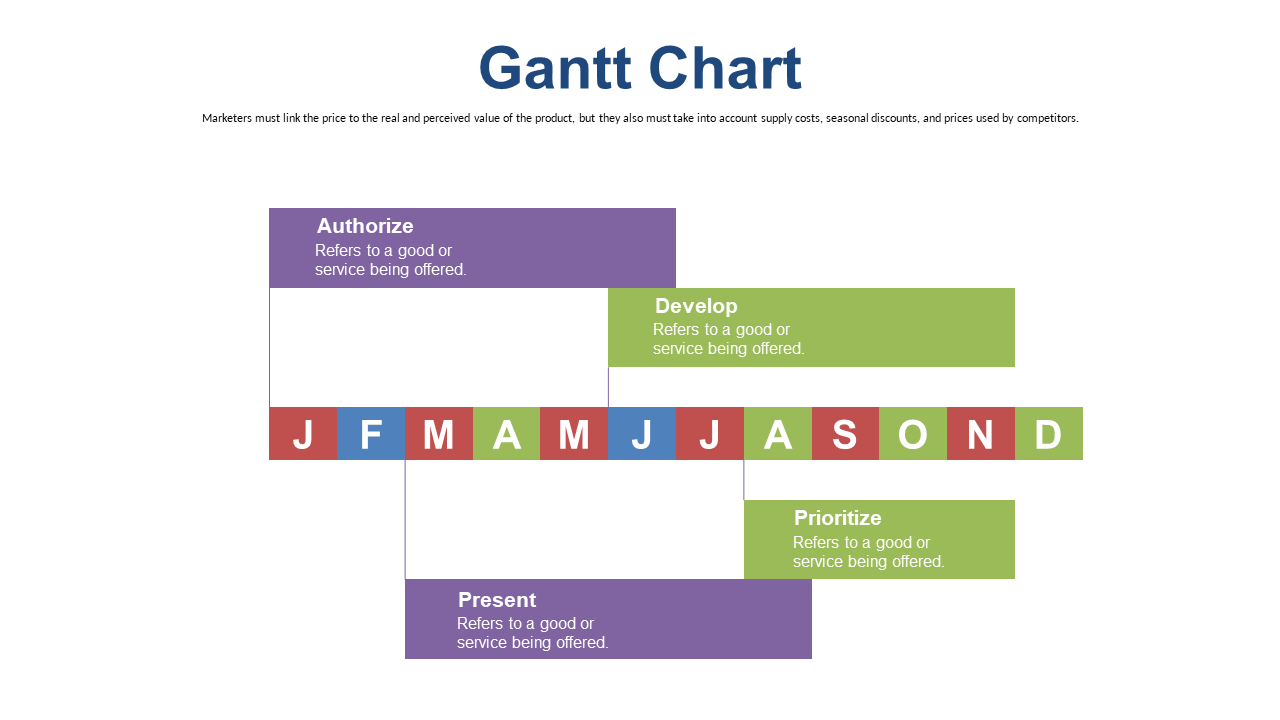
As a program manager, balancing various tasks can often feel like a juggling act, leading to potential setbacks. This editable Gantt chart slide provides a straightforward visual tool to illustrate project phases and keep everyone on the same page.
You’ll find this slide especially beneficial during team meetings, where clear communication about timelines and responsibilities is vital. It’s perfect for showcasing progress in regular updates or for aligning team members on project deliverables.
Available for only $0.99, you can download this slide right away and customize it as needed in PowerPoint or Google Slides. You’ll be able to present your project status with confidence in just a few minutes.
$0.99 – Purchase Checkout
Added to cart