Visualize PDCA Cycle for Continuous Improvement
Product Description
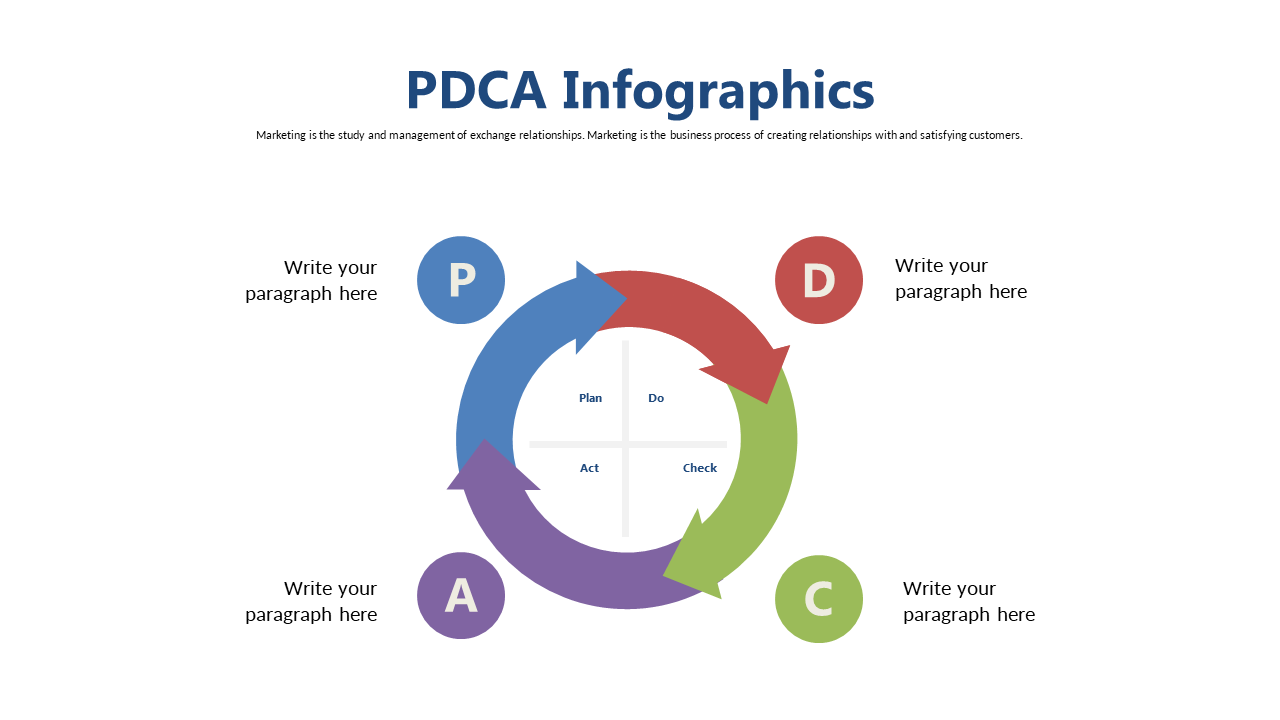
Communicating the nuances of continuous improvement can feel overwhelming, especially when clarity is key. This infographic slide visually simplifies the PDCA cycle, allowing your audience to grasp the essential concepts quickly and easily.
Ideal for team leaders presenting at departmental meetings, consultants during client workshops, or project managers outlining process enhancements, this slide aids in creating a shared understanding amongst diverse groups. Its clear layout facilitates better discussions and decision-making.
For just $0.99, you can instantly download this slide and customize it to suit your presentation’s theme. It’s fully editable in PowerPoint and Google Slides, enabling you to make changes in minutes.
$0.99 – Purchase Checkout
Added to cart







