Visualize Continuous Improvement with PDCA Cycle
Product Description
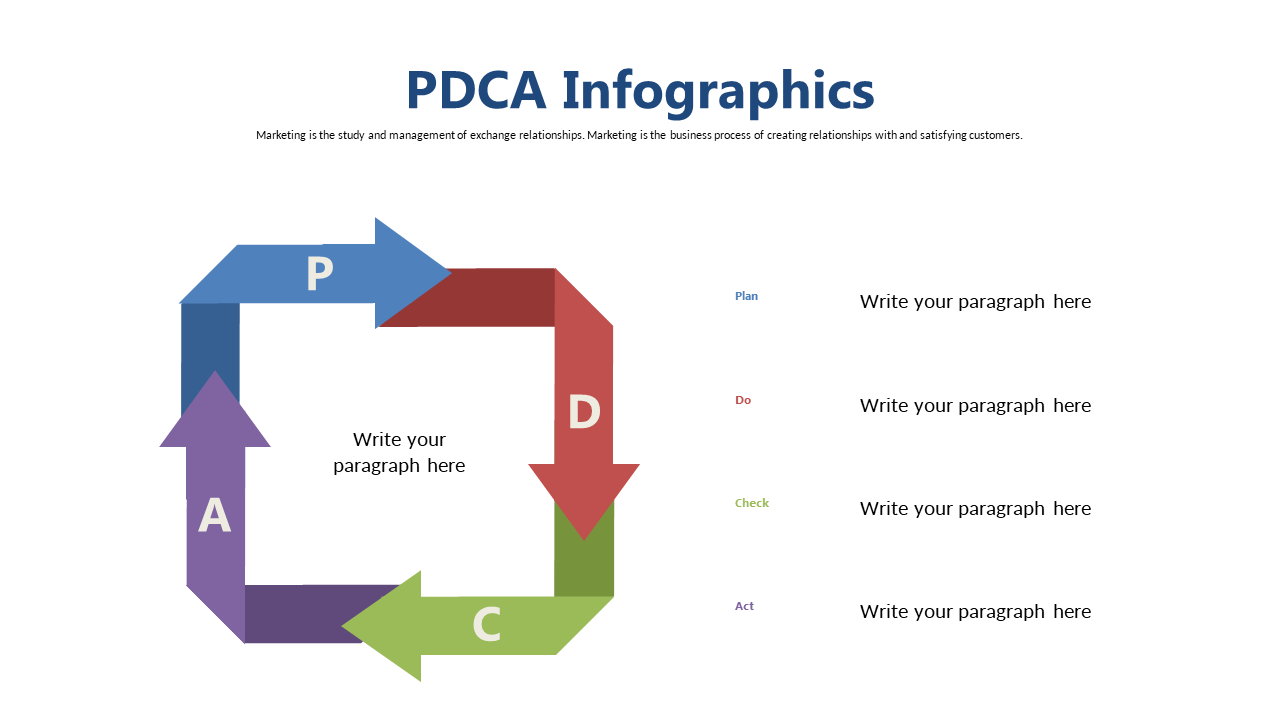
In a world where clear communication is crucial, explaining the continuous improvement process can be a challenge. This PDCA cycle infographic makes it simple to visualize the steps, allowing your audience to quickly grasp the concept without wading through complicated text.
With vibrant colors and a clean design, it turns a complex topic into an accessible visual representation. This slide is particularly useful for quality assurance professionals, business analysts, or consultants working in various industries who need to present the PDCA cycle during strategy meetings, training sessions, or performance reviews. It’s a powerful tool to ensure everyone understands the path to improvement.
For only $0.99, you can download this slide instantly and edit it in PowerPoint or Google Slides. It’s designed for quick customization, so you can focus on delivering your message effectively and efficiently.
$0.99 – Purchase Checkout
Added to cart