Showcase Achievements with Milestone Infographic V3

Product Description
When the pressure is on to display your achievements, a cluttered slide can lead to confusion. A clean visual representation can make complex information digestible.
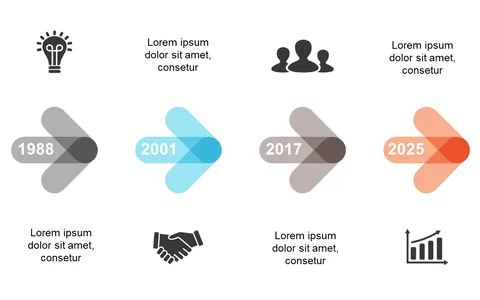
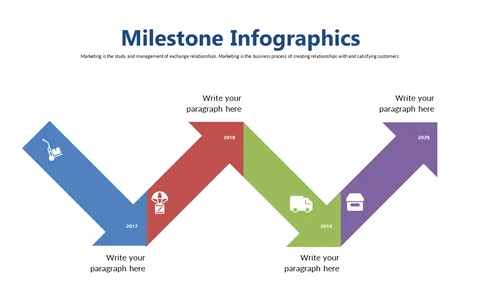
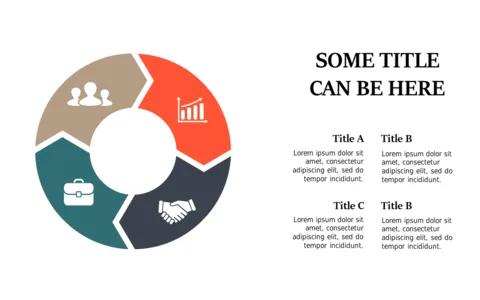
This milestone infographic slide uses clear arrows to depict various milestones over the years, simplifying your journey for the audience. Ideal for team leads summarizing project timelines or finance officers presenting budget forecasts, this slide is essential for anyone needing to communicate growth clearly. It’s particularly effective during all-hands meetings or client check-ins where clarity is paramount to the presentation’s success.
For just $0.99, you can download this customizable slide and get started right away in either PowerPoint or Google Slides. Make your achievements shine and keep your audience engaged!
$0.99 – Purchase Checkout
Added to cart