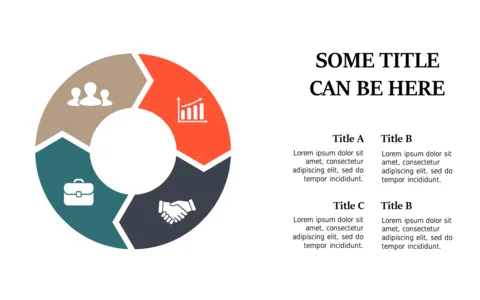
Engaging Milestone Infographic with Arrows V2

Product Description
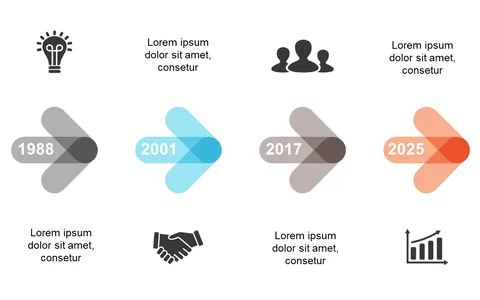
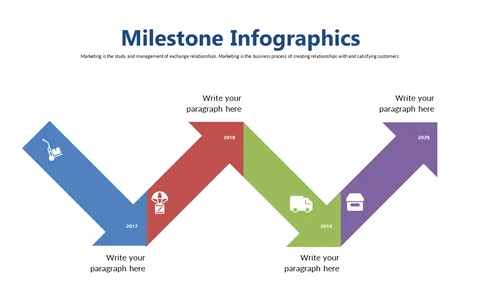
Keeping your audience focused while conveying progress can feel like walking a tightrope. You want to highlight your achievements without losing their interest, and that’s where this engaging milestone infographic comes in.
With arrows guiding your narrative, it transforms your timeline into a visually compelling story. This slide works wonders for executives presenting quarterly results to their teams or sales directors showcasing yearly growth to stakeholders. Use it during pitch meetings or industry conferences to ensure your audience can easily follow along with your key milestones and accomplishments.
At just $0.99, this slide is available for quick download and is fully editable in PowerPoint and Google Slides. Revamp your presentations instantly and make your achievements stand out!
$0.99 – Purchase Checkout
Added to cart