Showcase Progress with Milestone Infographic and Arrows

Product Description
When you need to demonstrate project progress, plain text just won’t cut it. It’s essential to present key milestones in a way that holds attention and invites understanding.
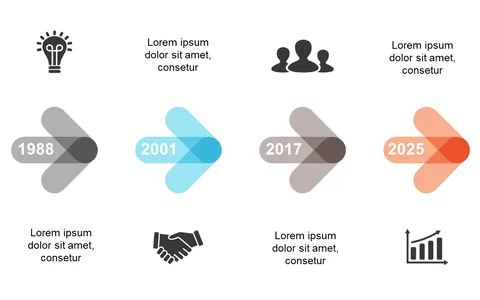
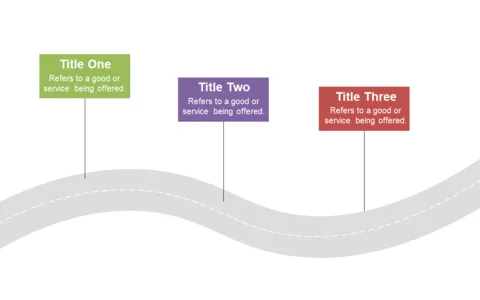
This vibrant milestone infographic slide features arrows and markers that guide your audience through your achievements chronologically. Project managers reporting on upcoming timelines or business analysts presenting results in team meetings will find this slide invaluable. It’s perfect for showcasing progress during annual reviews or in status updates where clarity and engagement are critical to keeping your audience aligned.
For only $0.99, you can download this eye-catching slide and customize it effortlessly in PowerPoint or Google Slides. Enhance your presentations quickly and effectively with this clear visual representation!
$0.99 – Purchase Checkout
Added to cart