Enhance Storytelling with Curved Arrow Milestone Infographic
Product Description
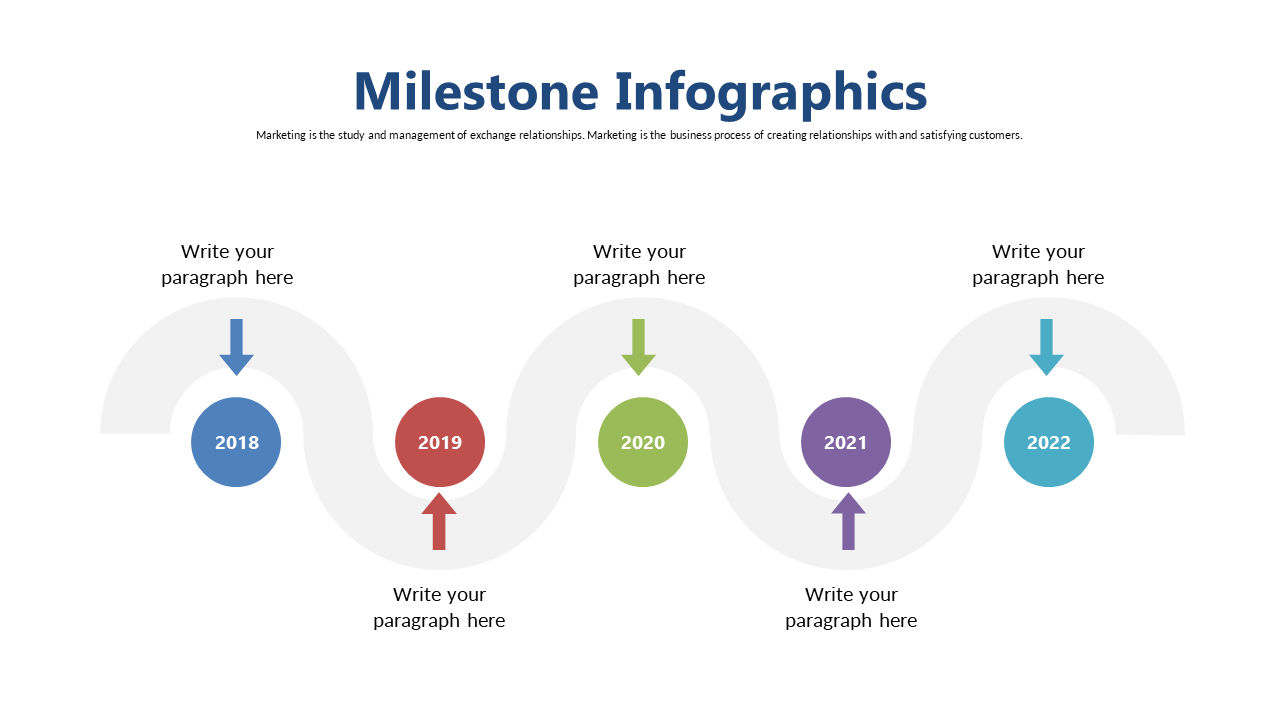
When you need to convey your project’s timeline, a lackluster presentation can leave your audience disengaged. The curved arrow milestone infographic allows you to illustrate key events while guiding your audience through the narrative, making your communication much more effective.
Ideal for product managers summarizing project phases, event coordinators outlining schedules, or team leaders showcasing progress during meetings, this slide provides a dynamic way to present your milestones. With its engaging design, your audience will stay connected to the story you’re telling every step of the way.
Available for only $0.99, this slide is ready for instant download and can be customized in PowerPoint or Google Slides. Make your storytelling more visually appealing and impactful with just a few clicks!
$0.99 – Purchase Checkout
Added to cart







