Visualize Data Comparison with Brush Stroke Infographic
Product Description
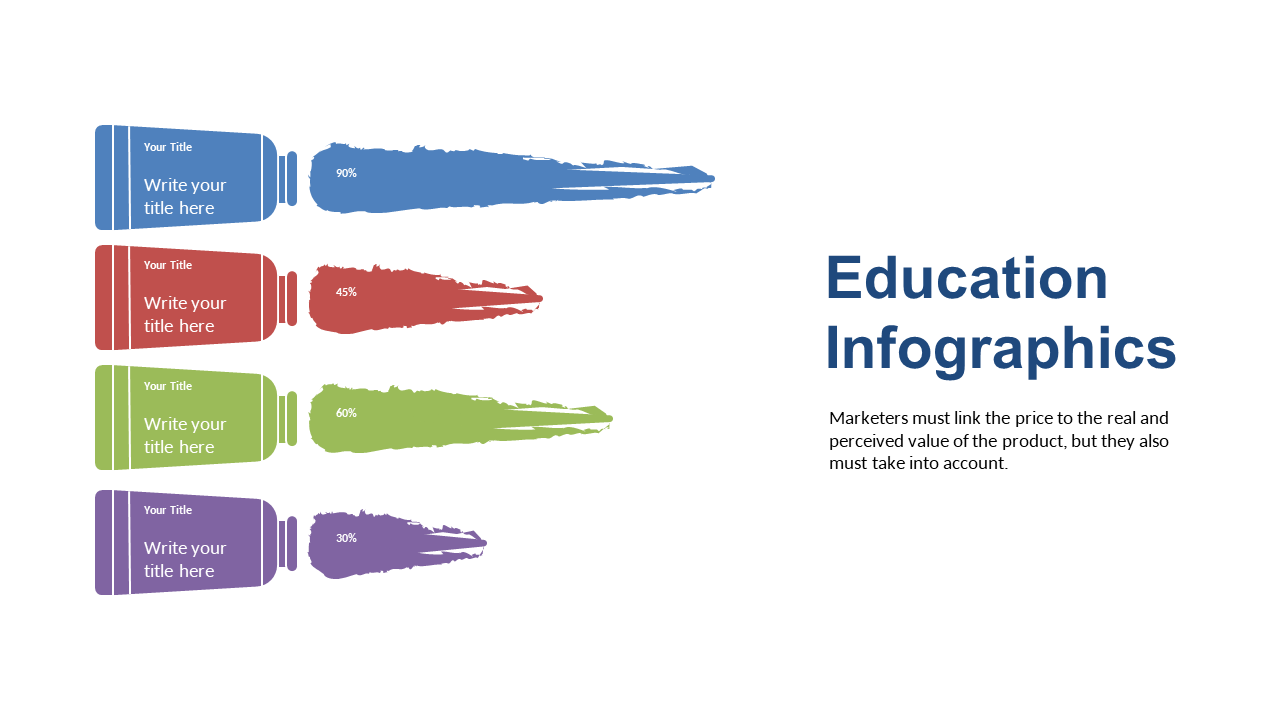
When presenting intricate data, capturing attention is vital, yet it can be challenging to present that information in an engaging way. If you’re looking for a captivating method to compare various metrics, this brush stroke infographic is just what you need. Its striking colors and unique design will help transform complex comparisons into an accessible visual format.
Picture a marketing analyst laying out campaign performance metrics or a project manager advocating for resource allocation among competing initiatives. This slide effectively showcases comparisons in a visually appealing manner, making it easier for your audience to grasp the information quickly.
It’s also valuable for sales teams presenting competitive analysis to colleagues or clients. You can get this slide for only $0.99, and it’s available for instant download. Editing is a breeze in PowerPoint and Google Slides, allowing you to customize it to fit your presentation effortlessly.
$0.99 – Purchase Checkout
Added to cart







