Customizable Layered Infographics for Medical Services
Product Description
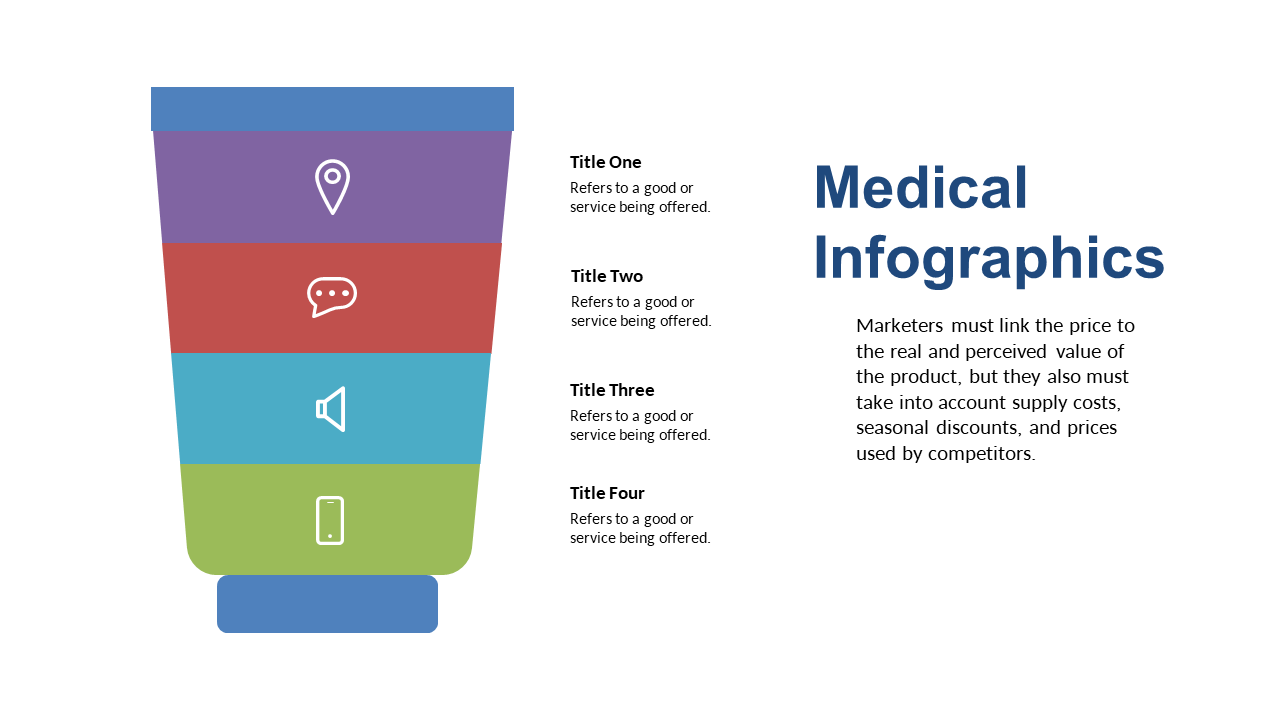
Translating intricate medical data into something your audience can digest is often a significant hurdle. This layered infographic design allows you to present various services distinctly while keeping the information clear and engaging.
You won’t have to worry about losing your audience’s attention anymore. Ideal for medical professionals, data analysts, or healthcare marketers, this slide is especially useful during presentations of service capabilities, training sessions, or client pitches where clarity is essential. Whether you’re showcasing new treatments or service offerings in a conference, this slide will enhance your storytelling.
Available for just $0.99, this slide can be downloaded right away and is fully editable in PowerPoint and Google Slides. Get it customized to fit your needs in a matter of minutes, so you can focus on delivering an impactful presentation.
$0.99 – Purchase Checkout
Added to cart







