Gantt Chart for Project Task Progress Tracking
Product Description
Managing a project without a clear visual can create chaos and lead to missed deadlines. Without an organized way to track progress, it becomes difficult to understand where things stand.
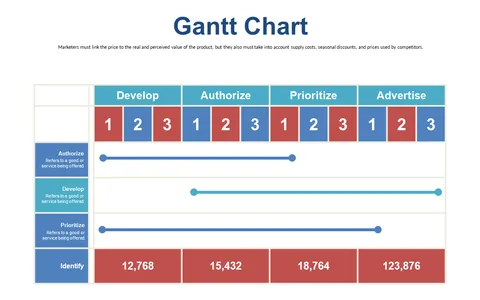
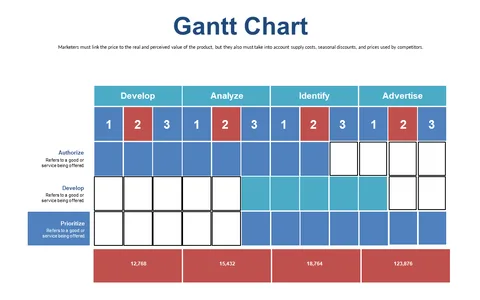
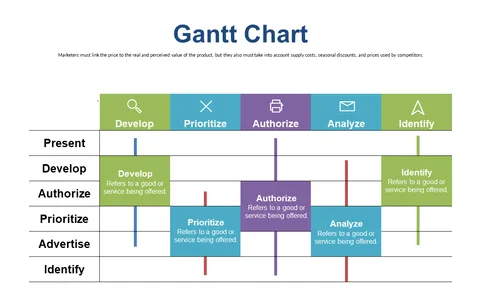
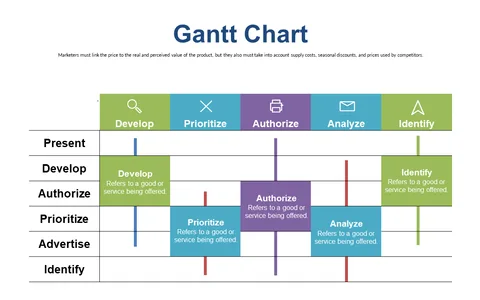
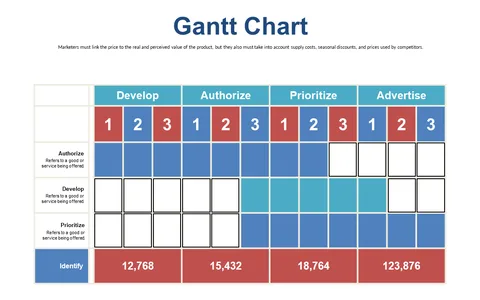
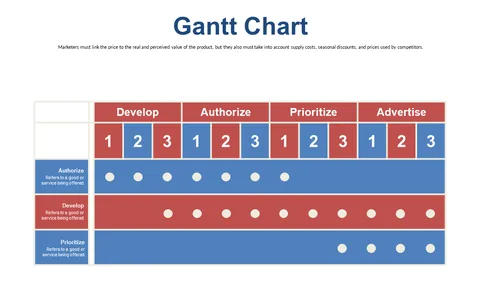
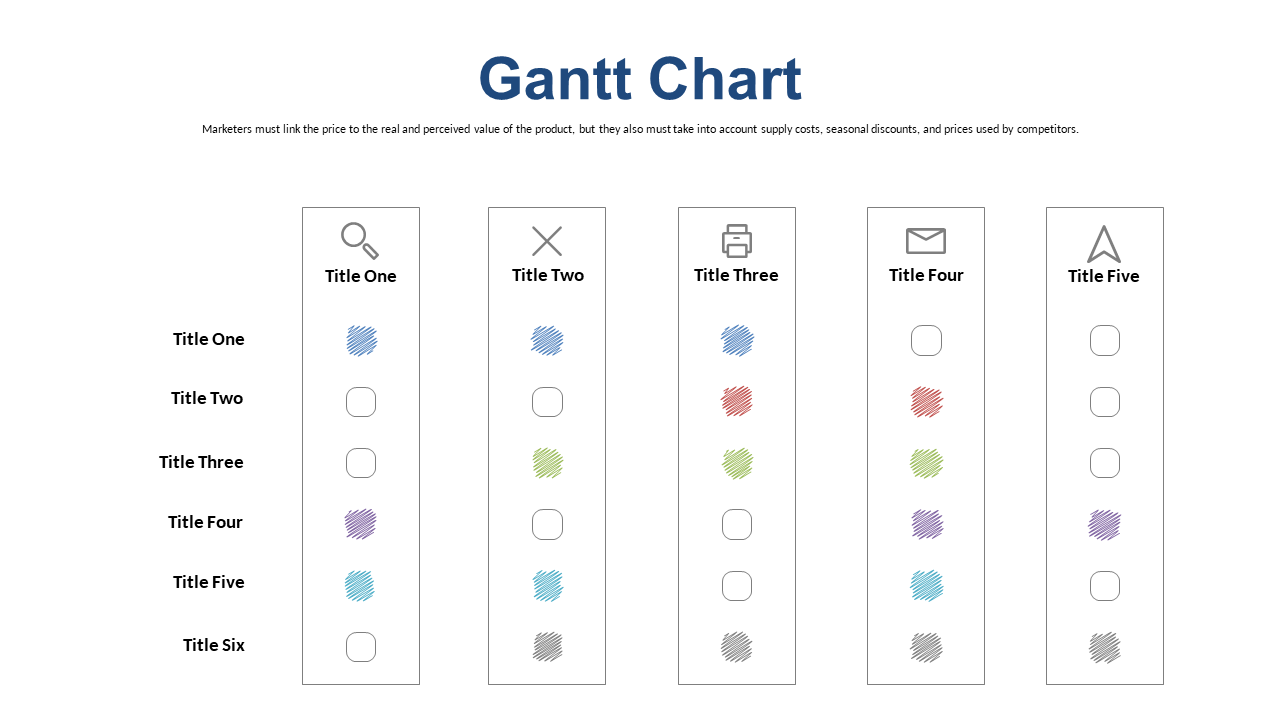
This Gantt chart slide offers a straightforward visual representation of your project timeline alongside task statuses, helping keep everyone aligned and informed. This slide is perfect for project managers coordinating complex marketing projects or team leaders who need to keep their teams accountable. Use it in status update meetings or during planning sessions to clearly communicate progress and next steps, ensuring that nothing is overlooked.
For only $0.99, you can download this Gantt chart slide and start editing it immediately in PowerPoint or Google Slides. Customize it effortlessly to reflect your project details, making it an essential tool ready in just minutes.
$0.99 – Purchase Checkout
Added to cart