Manage Project Phases with Gantt Chart Layout
Product Description
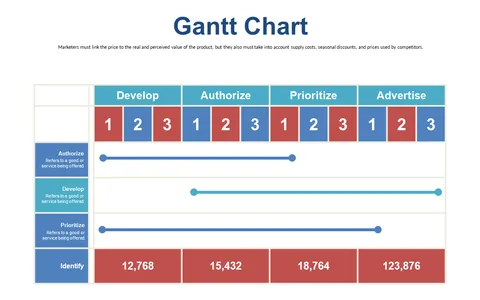
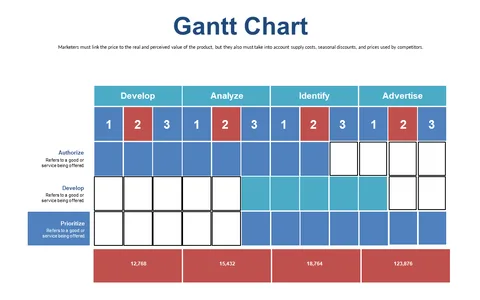
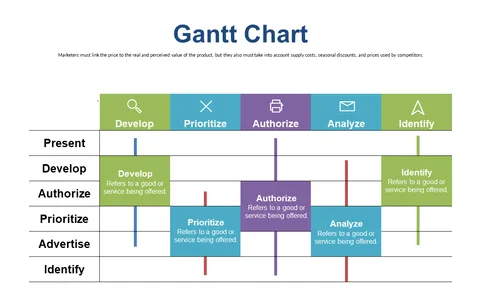
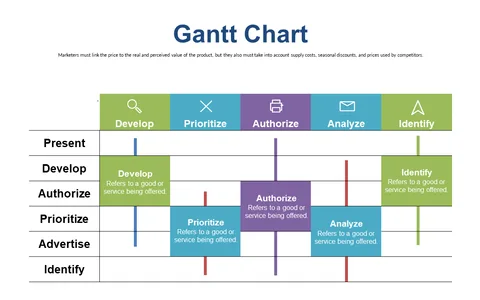
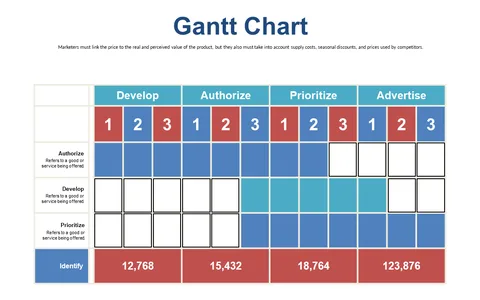
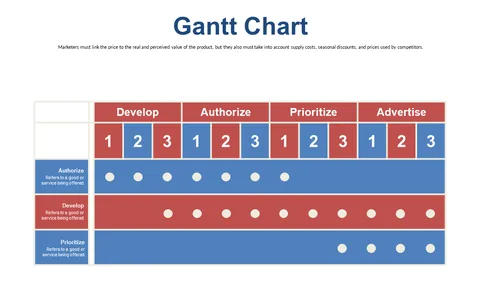
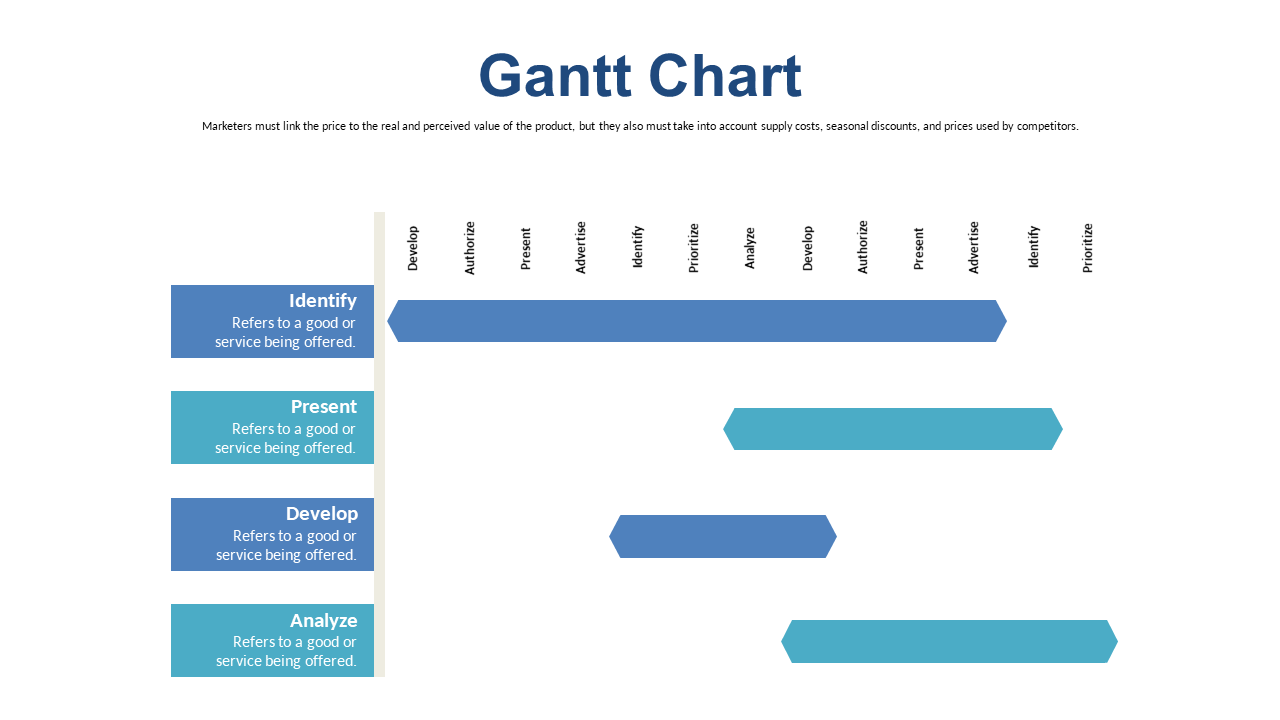
Managing project timelines can be a real headache, especially when you have multiple tasks competing for your attention. This Gantt chart layout simplifies the chaos by providing a clear visual representation of different project phases and activities, helping you to stay organized and on track.
Whether you’re a project manager leading a product development initiative or a marketing coordinator planning a campaign launch, this slide is perfect for you. In team meetings or progress updates, you can easily illustrate how each phase contributes to the overall timeline, making it easier for everyone to understand the project scope.
For just $0.99, you can instantly download this slide and edit it in PowerPoint or Google Slides. Customize it to fit your project’s specifics, ensuring that your team stays aligned and informed in minutes.
$0.99 – Purchase Checkout
Added to cart