Visualize Social Media Engagement with Infographic Layout
Product Description
In a world overflowing with data, presenting social media engagement metrics clearly can be overwhelming. You need a way to visually communicate this information that captures your audience’s interest without adding to the confusion.
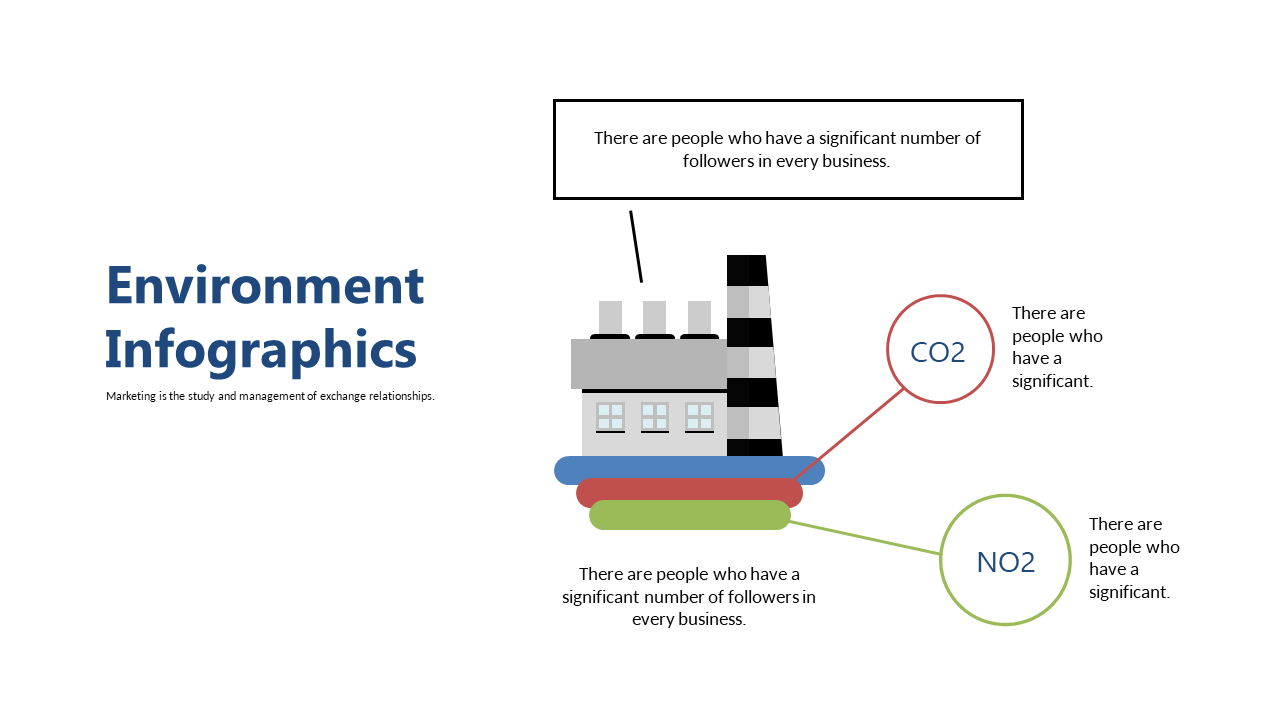
This infographic layout does just that, providing a striking visual representation of social media followership and engagement statistics. Digital marketers and social media managers will find this slide ideal for client presentations or team meetings where they need to showcase campaign performance. Whether you’re analyzing trends or pitching new strategies, this layout ensures that your social media insights come across powerfully and memorably.
Available for only $0.99, this slide is easy to download and customize. You can easily edit it in PowerPoint and Google Slides, making it ready for your next presentation in mere minutes.
$0.99 – Purchase Checkout
Added to cart







