Dynamic Bar Chart for Marketing Metrics
Product Description
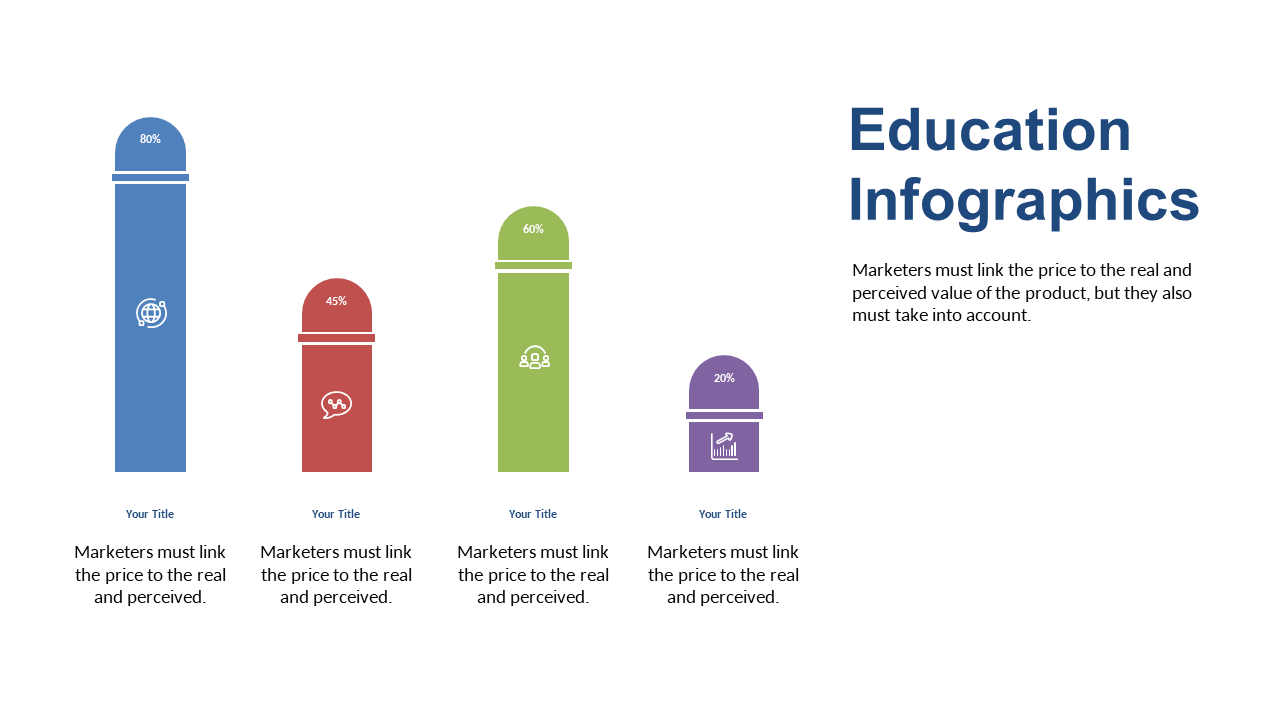
When it comes to making an impression with your marketing metrics, a standard presentation just won’t cut it. This dynamic bar chart captures attention while providing a clean format for showcasing your key performance indicators, making it easier for your audience to understand vital statistics.
Marketing managers and analysts can make good use of this slide during campaign reviews or strategy sessions, delivering insights in a way that resonates with their audience. It’s perfect for pitching to clients or stakeholders looking for concise data.
Get this slide now for just $0.99 and enjoy the convenience of downloading it instantly. You can edit it effortlessly in PowerPoint or Google Slides, ensuring your marketing metrics shine.
$0.99 – Purchase Checkout
Added to cart







