Engaging Bar Chart for Data Presentation
Product Description
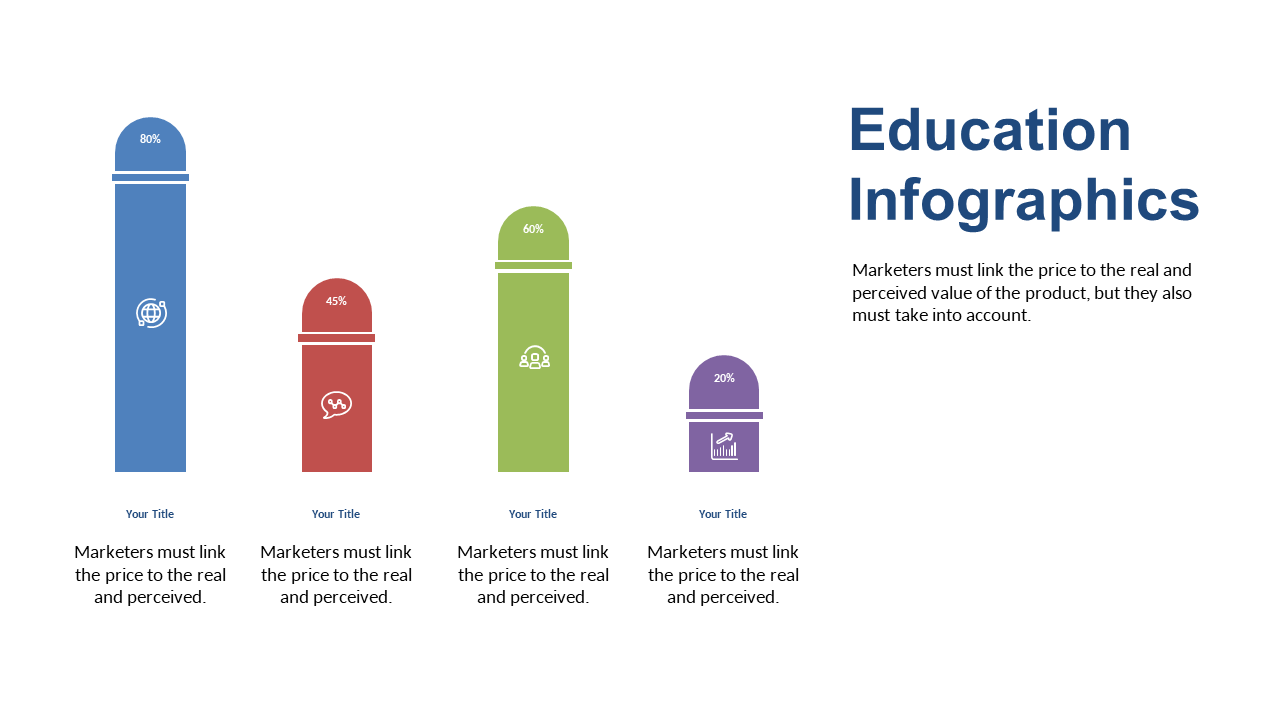
Choosing the right way to communicate data is crucial for ensuring your audience understands your key metrics. This engaging bar chart effectively displays your information in a straightforward way, helping your viewers quickly absorb crucial data points.
Data analysts or business consultants can employ this slide during performance reviews to highlight trends and outcomes clearly. It’s also suitable for financial presentations where stakeholders need to visualize quarterly performance.
Download this slide for only $0.99 and start editing it within minutes in PowerPoint or Google Slides. Present your data with confidence and clarity!
$0.99 – Purchase Checkout
Added to cart
✅ Instant delivery
✅ Fully editable
✅ PowerPoint & Google Slides
Category:
$0.99
Per slide · No minimum · Pay only for what you pick
✓ $0.99/slide
No minimum order
✓ Mix any category
No subscription
Building a full deck?
Mix slides from any of our 58 categories —
all merged into one PowerPoint.
$0.99/slide, no minimum.
Browse All Slides →







