Highlight Awareness, Knowledge, and Action Steps
Product Description
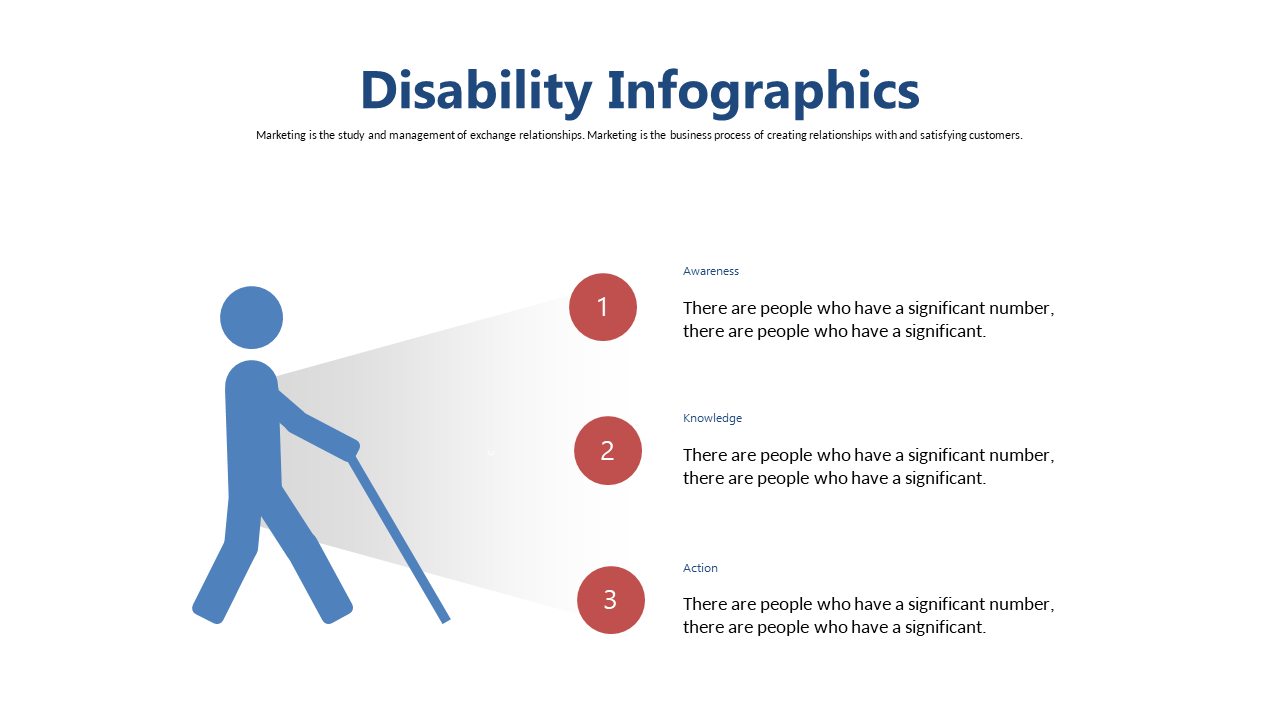
Navigating discussions around disabilities can be challenging, especially when you need to break down the statistics on awareness, knowledge, and action steps. This infographic slide helps you present complex data in a visually engaging way, making the information not just understandable but also memorable for your audience.
Ideal for social workers, educators, and nonprofit professionals, this slide is perfect for training sessions, community outreach presentations, or awareness campaigns. You’ll find it especially handy when addressing groups that may lack familiarity with these important topics, ensuring your message is clear and impactful.
At just $0.99, this slide is ready for instant download and easy to edit in both PowerPoint and Google Slides. You can quickly customize it to fit your specific needs and start making an impression in minutes.
$0.99 – Purchase Checkout
Added to cart







