Explore Disability Awareness Statistics Visually
Product Description
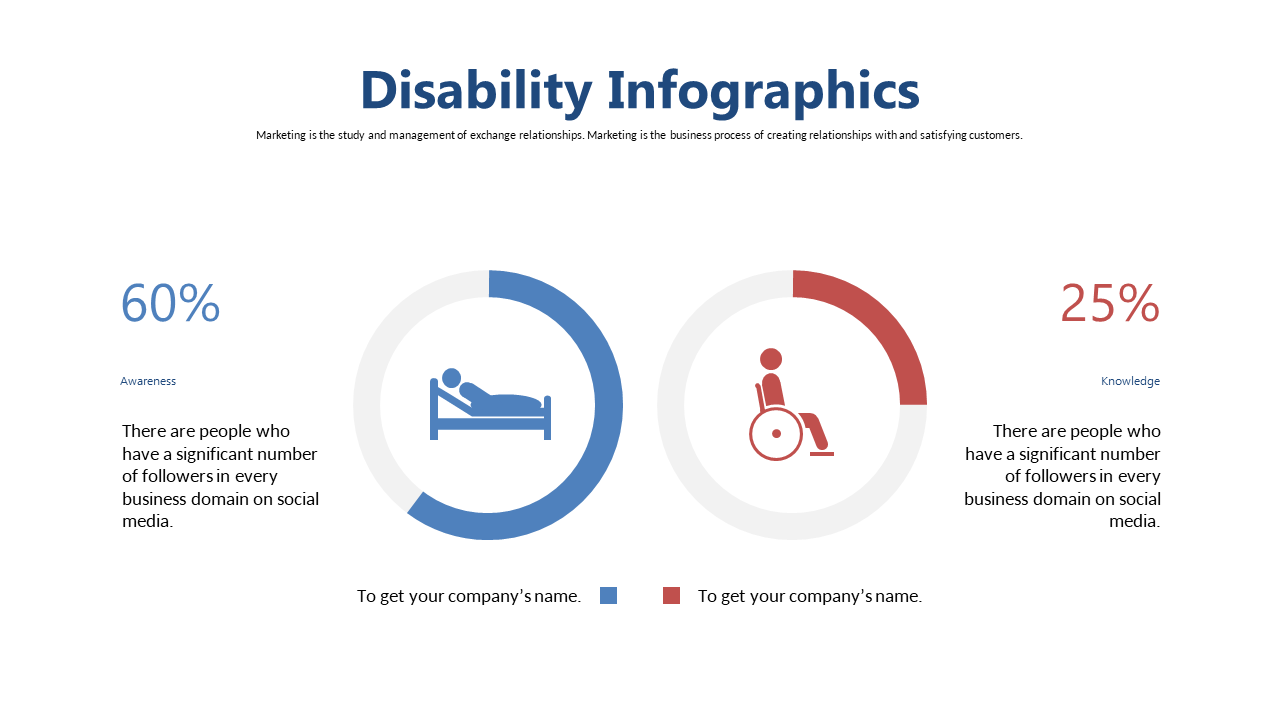
Effectively sharing disability awareness statistics today is more important than ever, yet many struggle to communicate this information effectively. This infographic slide captures attention and breaks down significant statistics using engaging visuals that make comprehension easier. It helps you convey vital information quickly and effectively.
Human resources professionals and diversity trainers can benefit from this slide during educational seminars or team-building workshops focused on inclusion. Community advocates can also employ it during public presentations, helping to raise awareness about disability-related issues in a clear format.
Your audience will appreciate the effort you put into making the statistics understandable. At just $0.99, this slide is available for instant download and is fully editable in PowerPoint and Google Slides. Customize it to match your style, and get started on enhancing your presentations right away.
$0.99 – Purchase Checkout
Added to cart







