Analyze Brands with Comparison Charts Infographics
Product Description
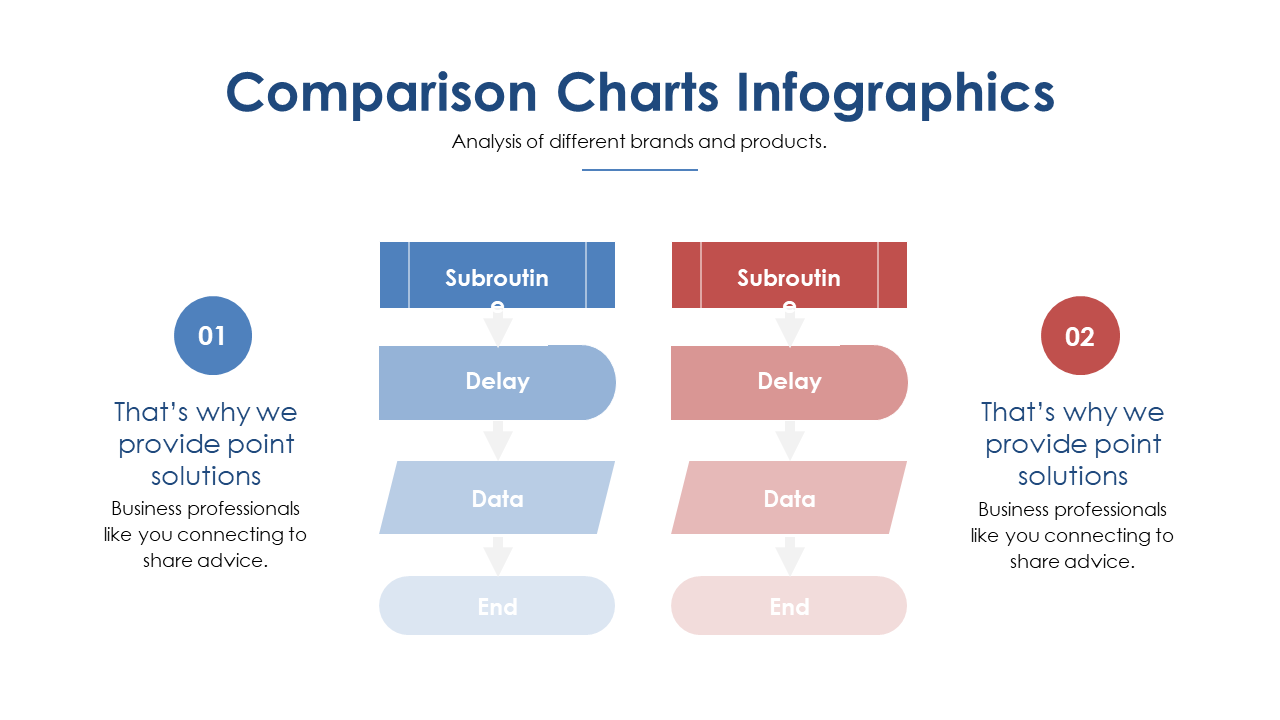
When assessing how different brands compare, it’s vital to present that information in a way that’s easy for your audience to digest. This slide resolves that issue with its comparison charts, offering a clear visualization of key differences across various brands and products.
It helps your audience grasp essential insights quickly. Perfect for marketing analysts, brand managers, or sales teams, this slide can be utilized in competitive analysis presentations, product launch strategies, or stakeholder meetings. You’ll be able to clearly show how brands stack up, which can aid in strategic discussions.
For only $0.99, you can download this slide immediately, customize it to match your corporate style, and use it in PowerPoint or Google Slides. Editing is straightforward, so you can get back to focusing on your presentation.
$0.99 – Purchase Checkout
Added to cart







