Present User Insights with Comparison Charts
Product Description
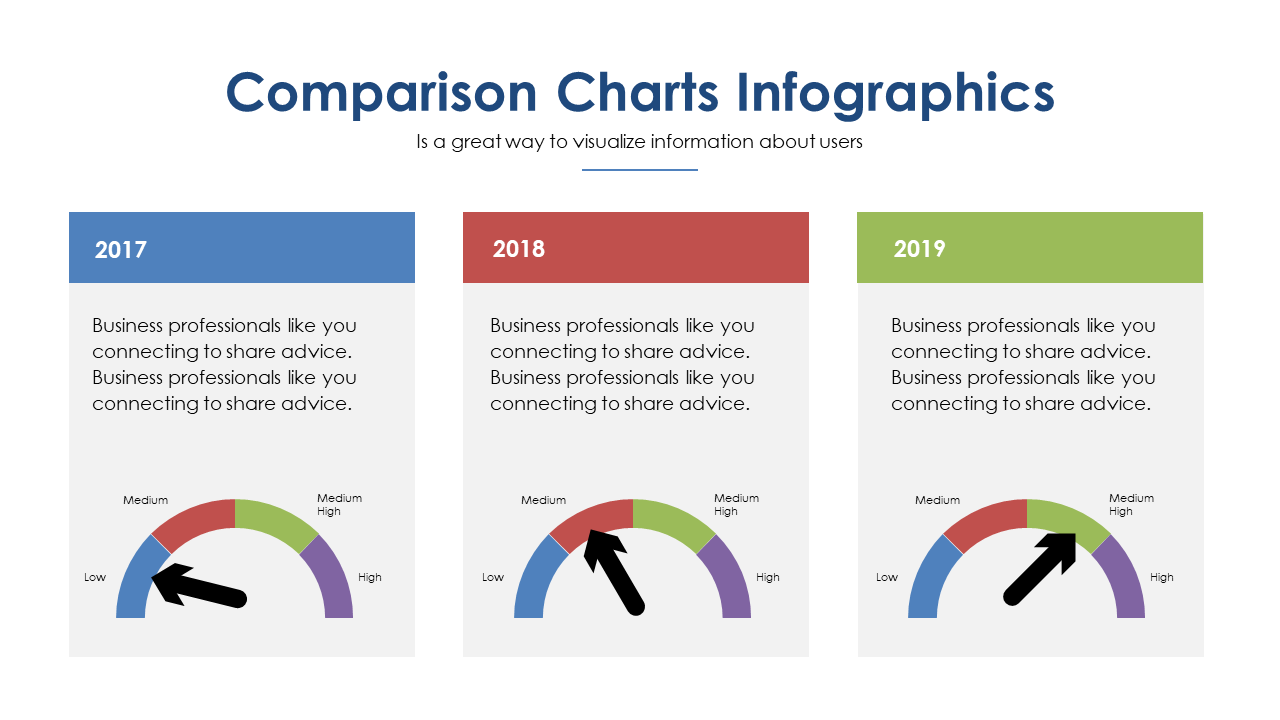
When you’re trying to present user insights, clarity can often take a backseat to complexity. This slide addresses that challenge by featuring three comparison charts that effectively display user data across three years, allowing you to highlight trends and shifts without overwhelming your audience.
It’s designed to make those insights pop, ensuring your message sticks. This slide is perfect for product managers analyzing customer feedback, market researchers presenting user behavior insights, or UX designers showcasing usability tests. Whether you’re in a quarterly review or a strategy meeting, these charts will help you convey crucial information succinctly.
For just $0.99, you can instantly download this slide, customize it to fit your branding, and start using it right away in PowerPoint or Google Slides. Editing is a breeze, so you have more time to focus on your insights.
$0.99 – Purchase Checkout
Added to cart







