Visualize Gender Distribution with Comparison Infographic
Product Description
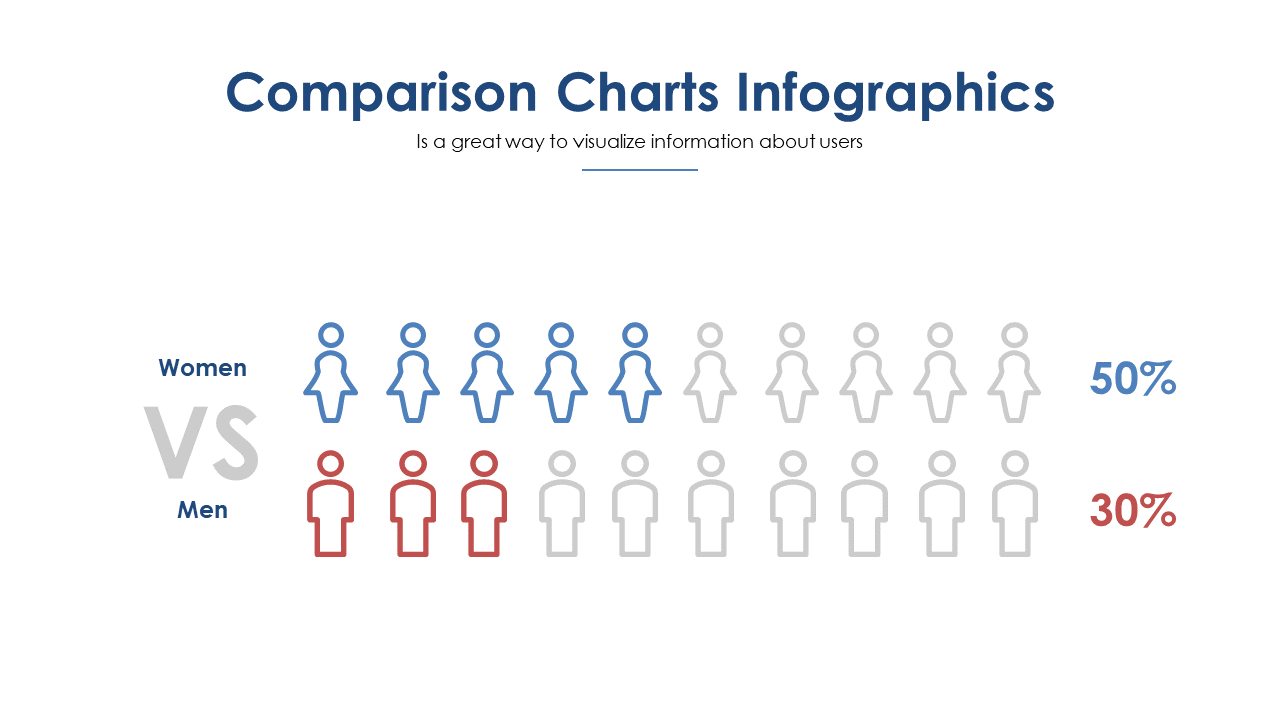
Effectively showcasing gender distribution data can be tricky, especially when you want to ensure your audience understands the implications. This infographic slide provides a straightforward and engaging way to present gender comparisons.
Its clear design helps convey key insights, making your message easy to grasp at a quick glance. Ideal for marketing professionals, HR analysts, and campaign managers, this slide is perfect for presentations on demographic insights and diversity initiatives. Whether you’re presenting in board meetings or community outreach sessions, it enhances your narrative around gender distribution.
For just $0.99, you can download this slide instantly and edit it in PowerPoint or Google Slides. Make your data presentations visually compelling and easy to understand in no time.
$0.99 – Purchase Checkout
Added to cart







