Illustrate Process Steps with Circle Infographics V7
Product Description
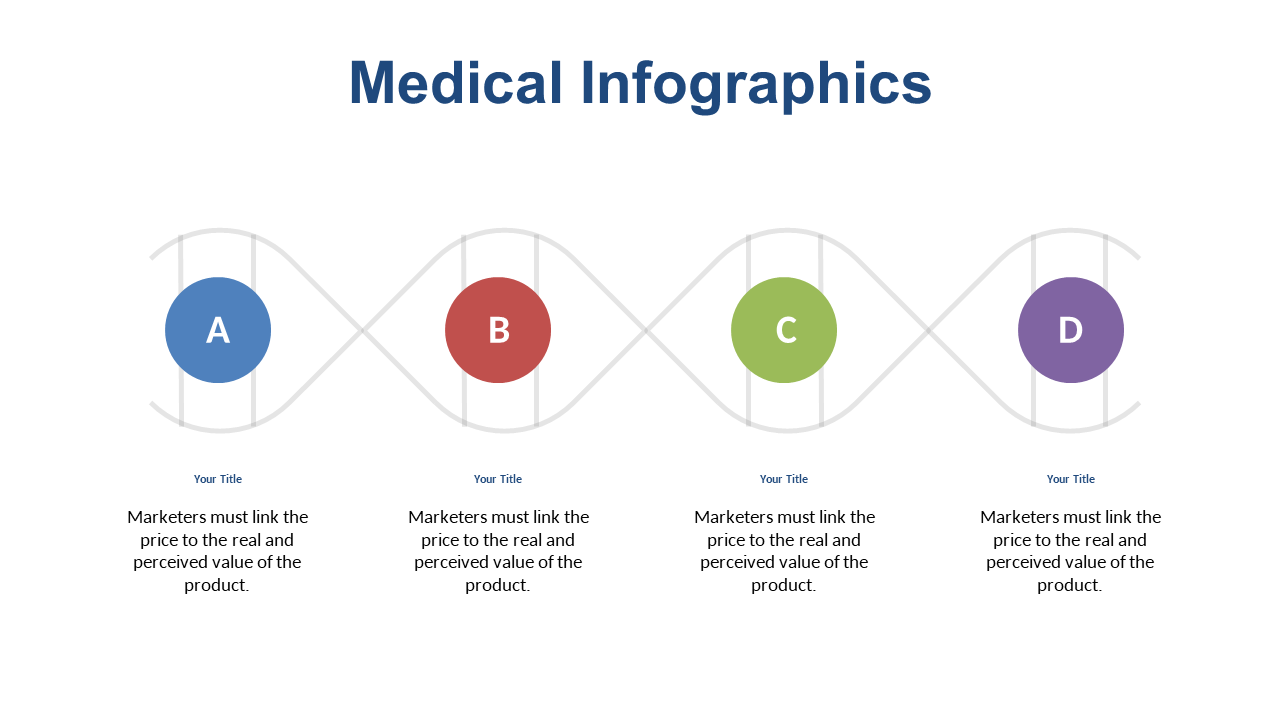
Making complex information digestible is a challenge many presenters face, often leaving audiences overwhelmed and confused. This slide helps you overcome that by offering four circular infographics that present your processes or key concepts in a clear and visually appealing way.
Your audience will appreciate the effort to simplify the message. This slide is particularly useful for product managers conducting sprint reviews, educators explaining curriculum phases, or consultants presenting strategic plans. The circular infographics can enhance clarity in various meeting types, making sure your audience absorbs the information without frustration.
Grab this slide for just $0.99, and enjoy instant download access. It’s easily editable in both PowerPoint and Google Slides, giving you the tools to make your presentation shine in no time.
$0.99 – Purchase Checkout
Added to cart







