Compare Products with Quad Sections Infographic
Product Description
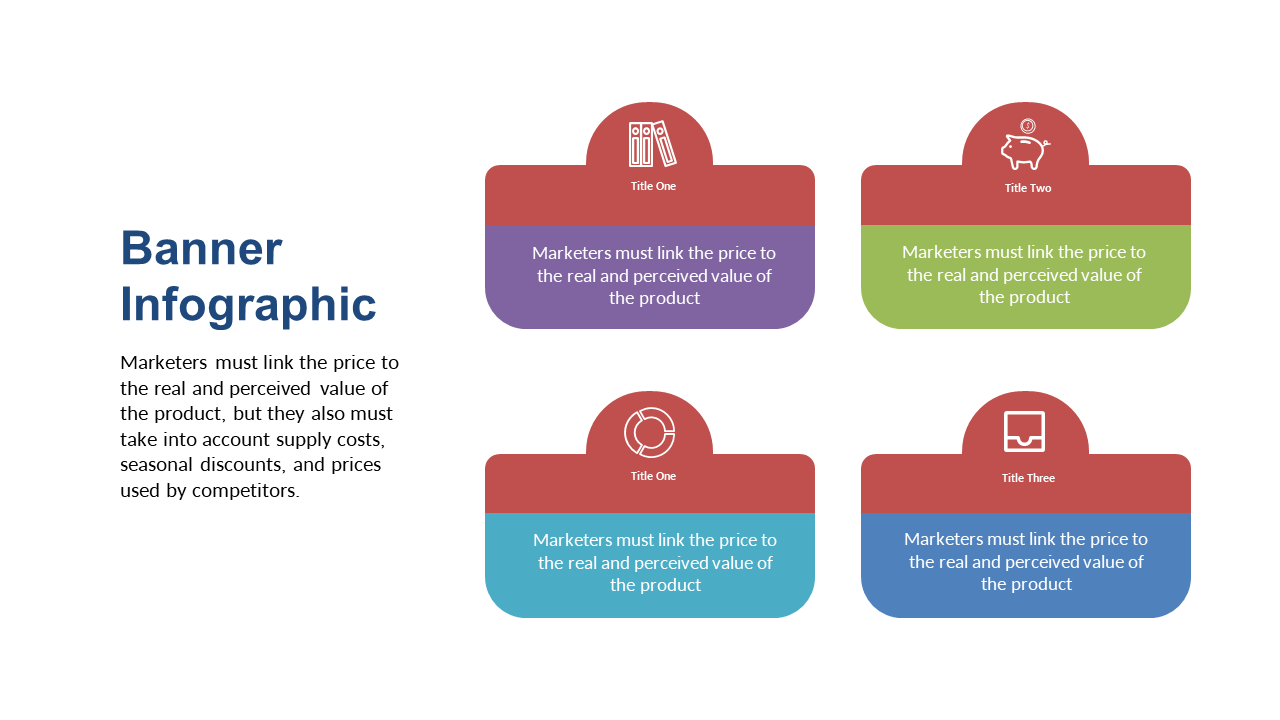
When comparing multiple products, showcasing relevant data without overwhelming your audience can be tricky. A cluttered presentation can lead to misunderstanding and disengagement. This quad sections infographic provides a clear format for comparing products side by side, enhancing clarity and visual appeal.
Product managers, marketing specialists, and sales reps will find this layout invaluable during product launch meetings or when conducting competitive analysis sessions. It’s the ideal tool for those needing to give potential customers a detailed yet straightforward comparison of various offerings.
For just $0.99, this slide is available for instant download, and
you can easily customize it to match your brand. It’s designed to work smoothly in both PowerPoint and Google Slides, allowing for quick edits and updates.
$0.99 – Purchase Checkout
Added to cart