Showcase Key Points with Infographic Sections V2

Product Description
Feeling the pressure to convey complex information simply is all too common. In today’s fast-paced work environment, clear communication is not just a preference but a necessity.
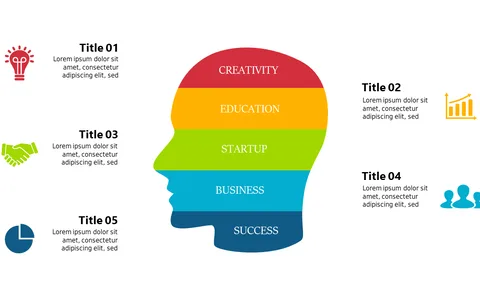
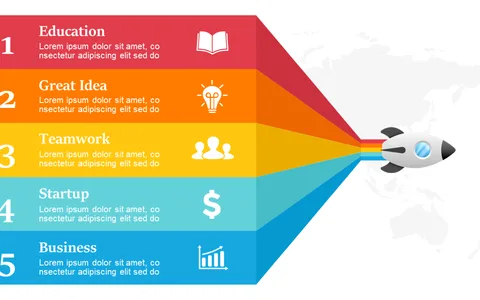
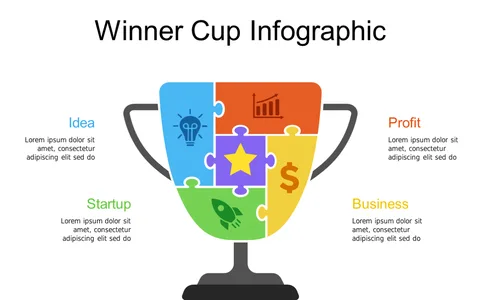
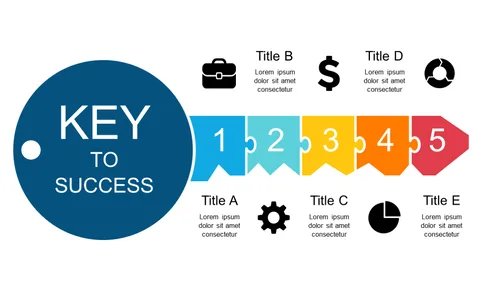
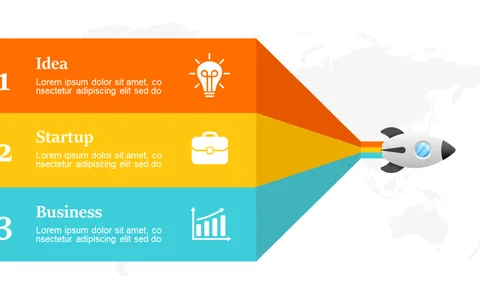
This infographic slide provides a structured way to showcase your key points with visually distinct sections that grab attention. Ideal for marketing professionals crafting campaign updates or analysts presenting research findings, this slide is versatile for anyone needing to make information relatable and comprehensible. It’s particularly effective during all-hands meetings or strategy sessions where clarity is paramount.
Available for only $0.99, this slide is ready for instant download and can be easily customized in PowerPoint or Google Slides. You’ll have a polished presentation ready in no time.
$0.99 – Purchase Checkout
Added to cart