Visualize Growth Metrics with Tree Illustrations
Product Description
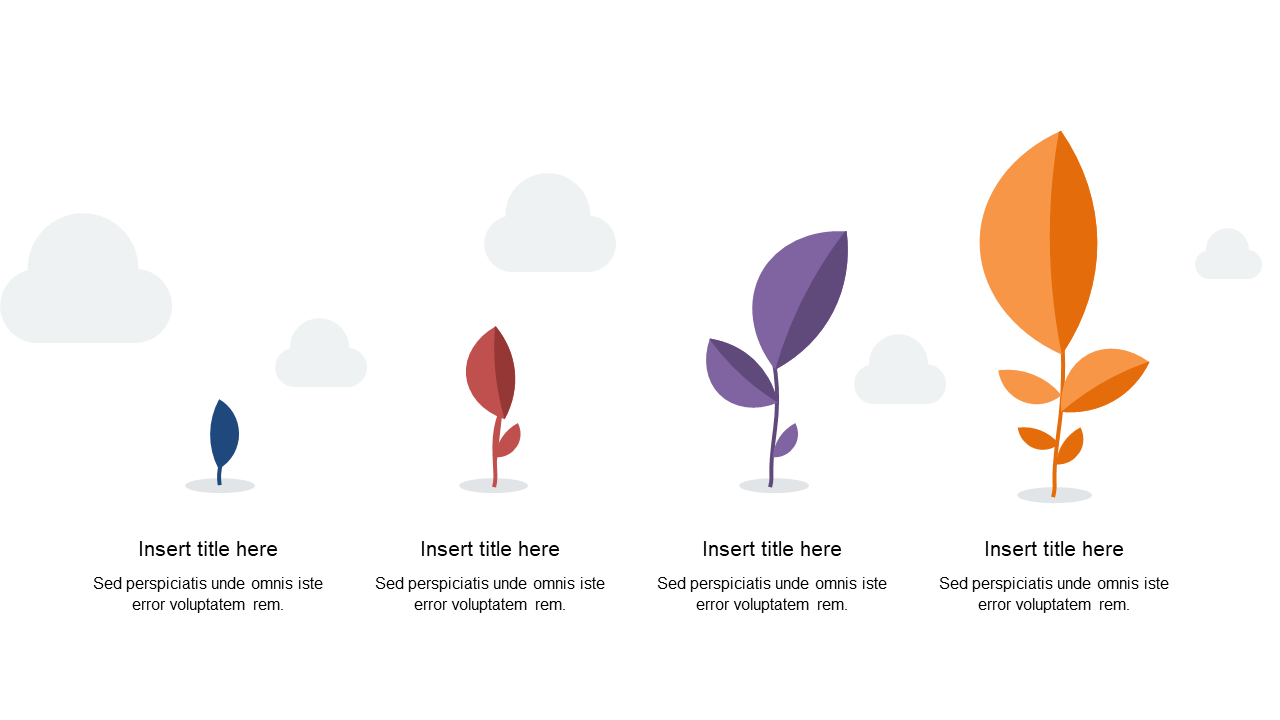
Showcasing growth metrics can be a tricky task, especially when you aim to keep your audience engaged. This slide utilizes captivating tree illustrations to represent various stages of development, making complex information more digestible.
Your key insights will shine through, effortlessly drawing in your viewers. Perfect for content strategists, marketers, or business analysts who need to present growth trends, this slide works wonders during annual reviews or strategy planning sessions. It helps you communicate growth narratives clearly and effectively, regardless of your industry.
For only $0.99, this slide offers an instant download and is quick to edit, allowing you to make it your own. You can easily modify it in PowerPoint or Google Slides, so you’ll have your presentation ready in just minutes.
$0.99 – Purchase Checkout
Added to cart







