Visualize Data with Engaging Donut Diagram
Product Description
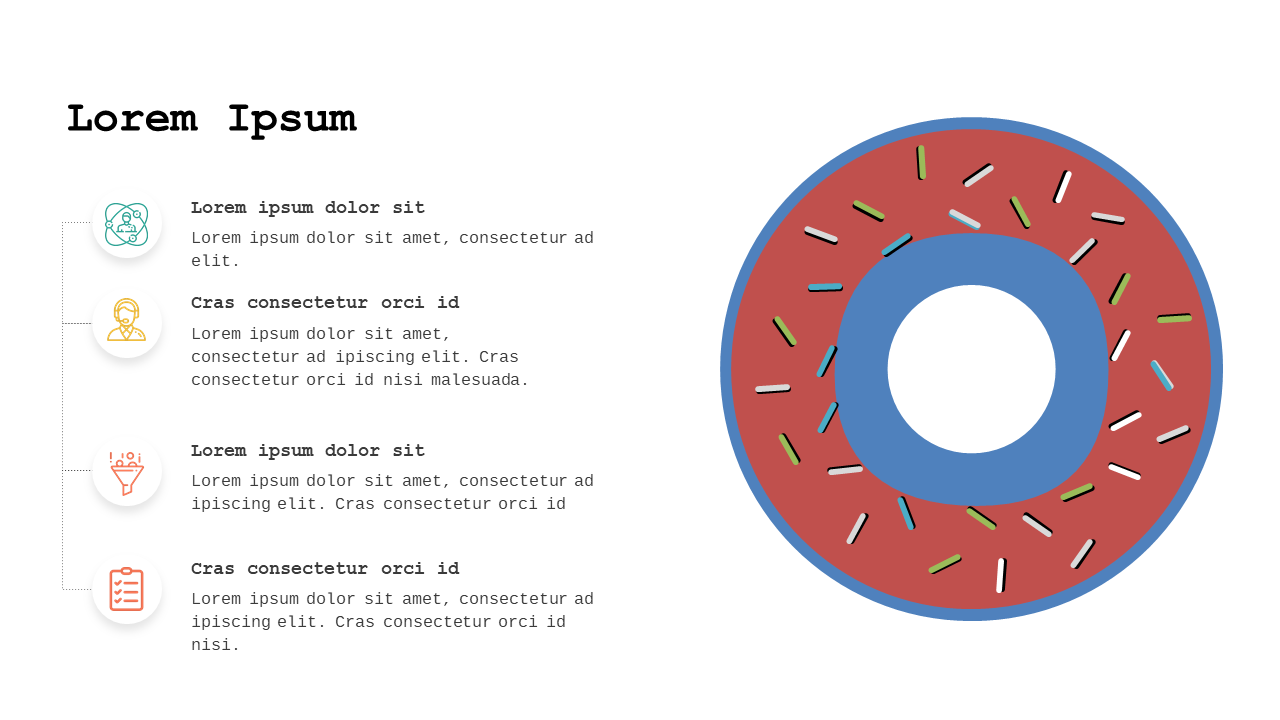
When you’re tight on time but need to present data effectively, a traditional chart just won’t cut it. This slide allows you to transform your data into an engaging donut diagram, making your information visually appealing and easier to digest.
Data analysts and marketing professionals will find this slide particularly useful during performance reviews, sales presentations, or any situation that requires data storytelling. It helps illustrate key metrics while keeping your audience engaged and informed.
For only $0.99, this slide can be downloaded instantly and edited in PowerPoint or Google Slides. Customizing it to fit your data and narrative is straightforward, so you can focus on delivering your presentation without delay.
$0.99 – Purchase Checkout
Added to cart







