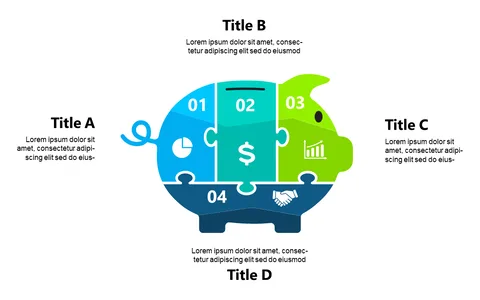
Analyze Financial Strategies with Quadrant Diagram

Product Description
Understanding financial strategies can be a complex task, particularly when trying to juggle multiple components. You need a format that makes it easy for your audience to follow along and comprehend your analysis.
This quadrant diagram slide presents a clear layout that simplifies your financial discussions. This slide is ideal for financial analysts preparing investment strategy presentations, budget managers discussing annual plans, or CFOs portraying financial forecasting to their executive team. If you’re navigating a financial review meeting or an investor pitch, this layout helps you communicate effectively and efficiently.
For only $0.99, you can download this slide right away and modify it to fit your specific requirements. It’s compatible with both PowerPoint and Google Slides, making it incredibly convenient to create a professional presentation in a matter of minutes.
$0.99 – Purchase Checkout
Added to cart