Visualize Project Progress with Percentage Bars
Product Description
Keeping stakeholders informed about multiple projects can be a challenge, especially when everyone has different levels of understanding. You need a straightforward way to communicate progress that everyone can understand at a glance.
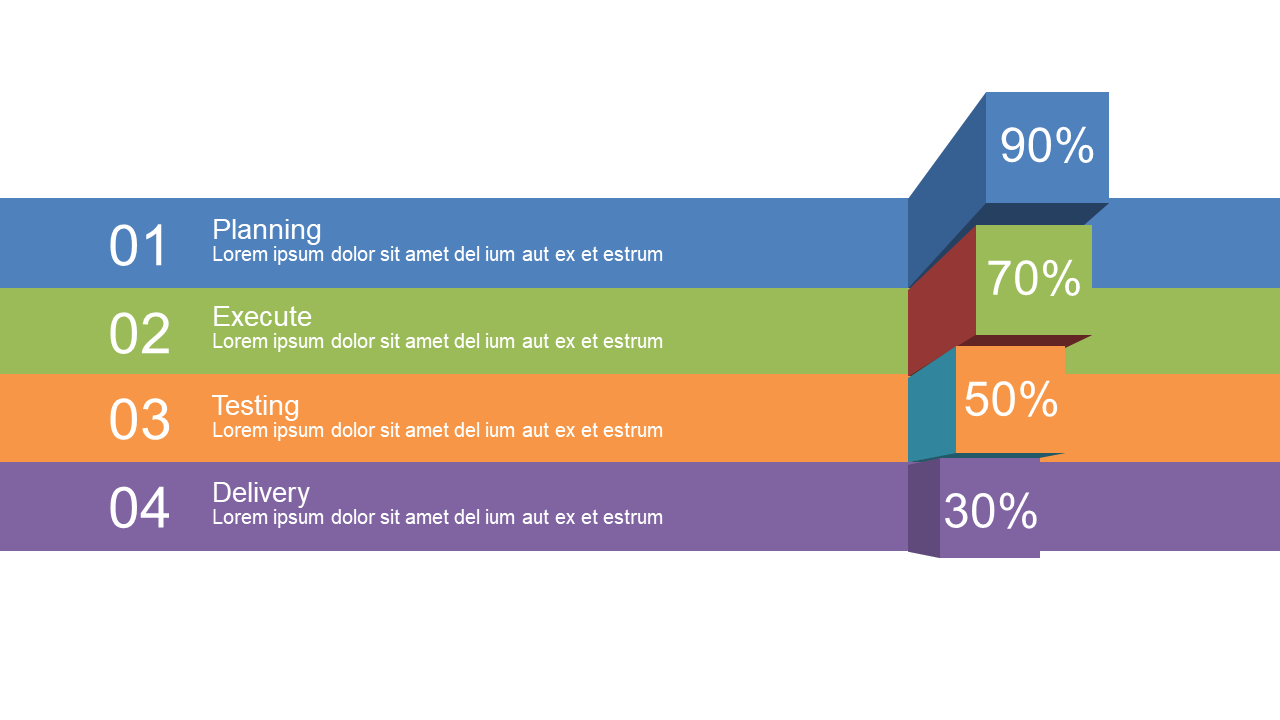
This slide offers a clear visual representation of your project milestones using horizontal percentage bars. This layout works well for project managers updating team members in status meetings, executives presenting performance metrics to board members, or even sales leads discussing progress with clients. Wherever you need to illustrate growth and progress clearly, this slide fits the bill.
For just $0.99, you can download this slide instantly and customize it easily in PowerPoint or Google Slides. Make your project updates clear and engaging with minimal effort.
$0.99 – Purchase Checkout
Added to cart