Energy Sources Contribution Pie Chart for Presentations
Product Description
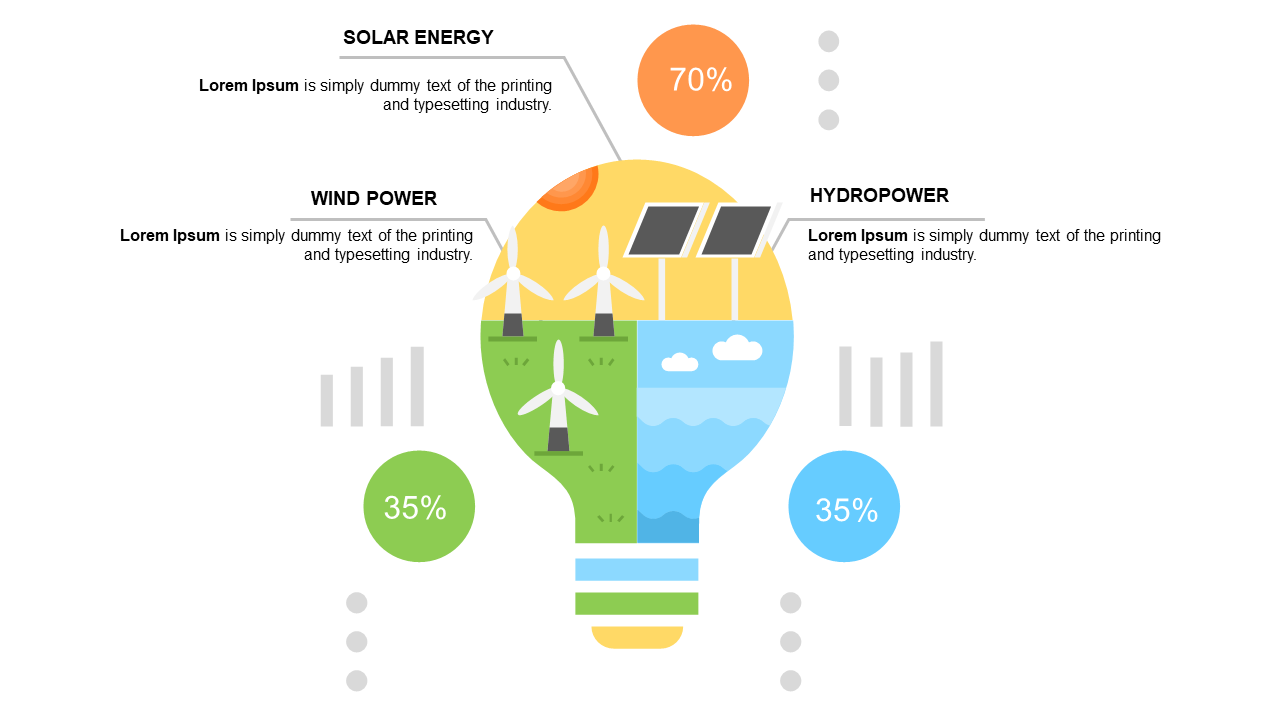
Conveying the complexities of energy contributions can often leave your audience confused or disengaged. A well-designed pie chart can transform this challenge into a clear visual narrative, making it easy for viewers to grasp the significant role of each energy source at a glance.
Energy analysts, environmental scientists, and project managers in renewable energy sectors will find this slide particularly useful. Whether you’re presenting at a community forum, a corporate sustainability meeting, or an educational workshop, this pie chart helps you break down the contributions of solar, wind, and hydropower, ensuring your points are well understood.
For just $0.99, you can instantly download this slide and easily edit it in PowerPoint or Google Slides to fit your specific content needs. Don’t waste time on complicated visuals—grab this slide and have your presentation ready in minutes.
$0.99 – Purchase Checkout
Added to cart







