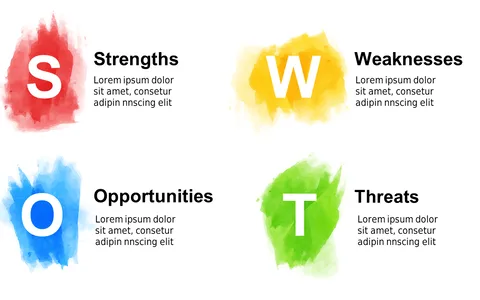
Visualize Weaknesses in SWOT Analysis

Product Description
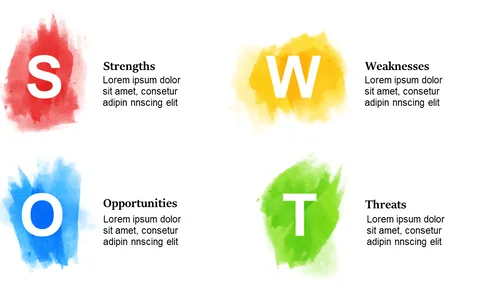
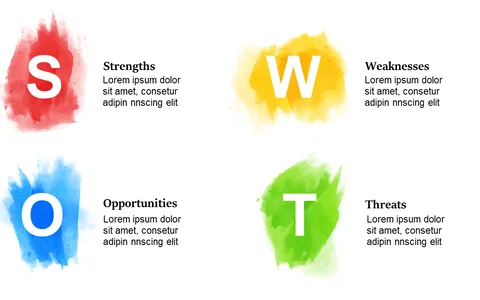
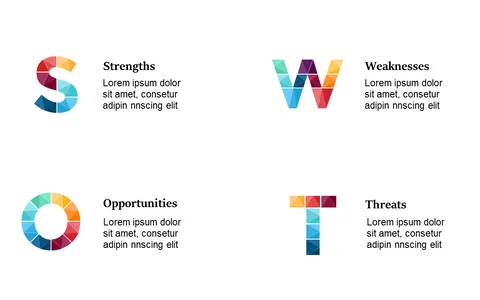
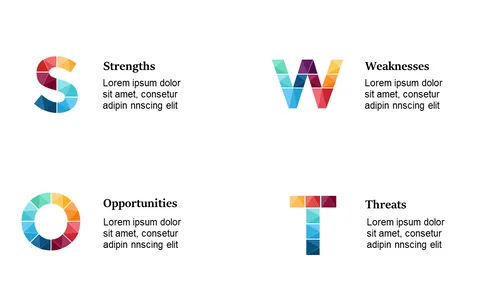
Recognizing and clearly presenting weaknesses in a SWOT analysis can often feel like a daunting task. If you struggle to communicate internal challenges effectively, this Visualize Weaknesses slide provides a straightforward solution.
The bold icon and descriptive text make it easier to articulate these points and foster meaningful discussions. This slide is especially useful for strategic analysts and team leaders facing internal reviews, risk management meetings, or performance evaluations. Use it to guide conversations about areas for improvement during team sessions or to inform higher-ups about where attention is needed.
For just $0.99, you can quickly download this slide and start customizing it to fit your presentation needs. It’s fully editable in PowerPoint and Google Slides, ensuring that you can make changes effortlessly in just a few minutes.
$0.99 – Purchase Checkout
Added to cart