Visualize Project Priorities with Stacked Coins
Product Description
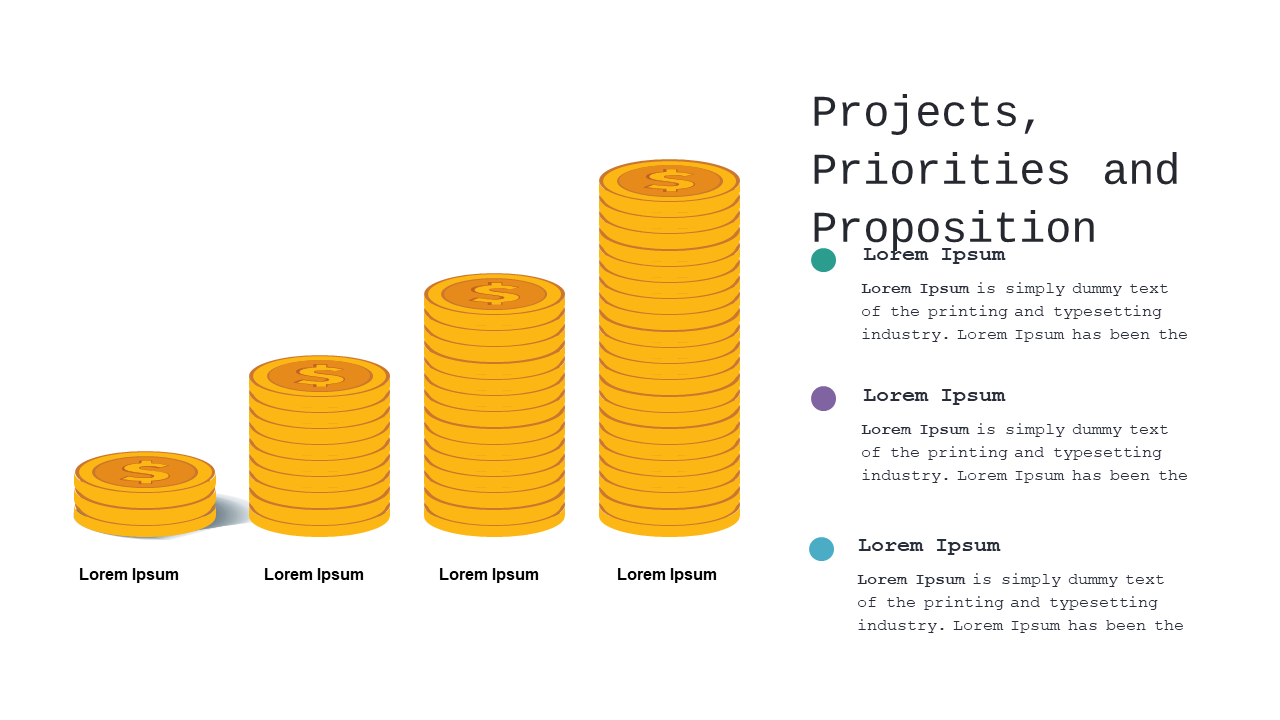
Navigating project priorities can be a daunting task for financial analysts, especially when faced with competing demands and deadlines. This slide helps you present those priorities clearly and visually, using a stacked coins graphic that visually communicates the relative importance of each project or initiative. It takes the guesswork out of discussions and decision-making.
This slide is perfect for finance professionals, project managers, or budget analysts who are preparing budgets or project proposals. You’ll find it particularly useful during quarterly budget reviews or project prioritization meetings where clarity is key.
It ensures that everyone understands the priorities, making for more informed conversations. For just $0.99, you can instantly download this slide and start customizing it for your needs. It’s editable in PowerPoint and Google Slides, allowing you to tailor the message in just a few minutes.
$0.99 – Purchase Checkout
Added to cart