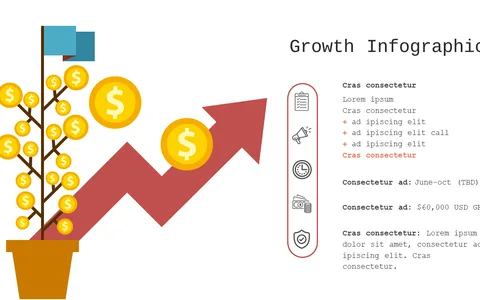
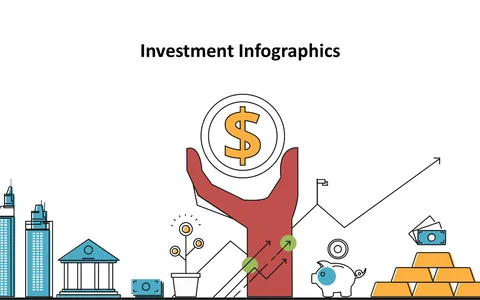
Represent Financial Growth with Money Tree Infographic
Product Description
In today’s financial landscape, illustrating growth and investment opportunities effectively is crucial. You need a visual representation that stands out and clearly communicates these concepts.
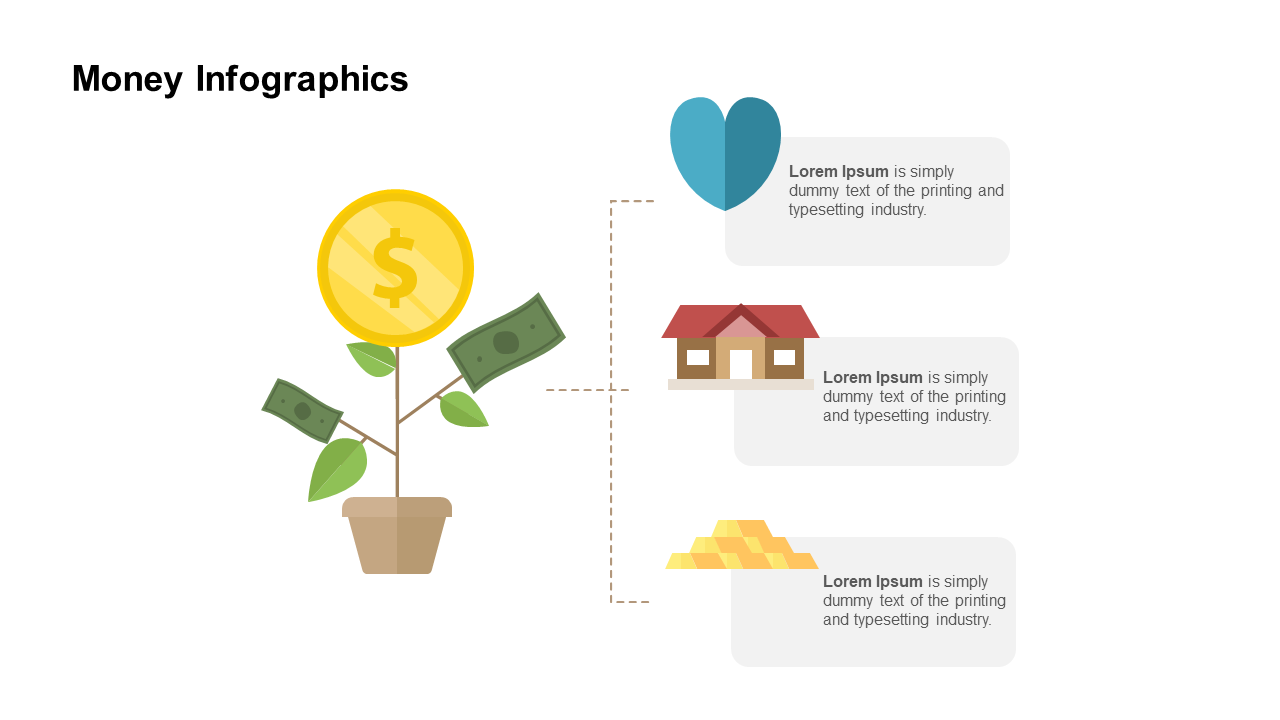
This slide features a captivating money tree infographic, adorned with various currency symbols and investment icons, to emphasize financial growth. Finance professionals, investment advisors, and budget analysts will find this slide useful for presentations focused on financial projections or investment opportunities. It’s perfect for client meetings or financial reports where conveying growth potential in a visually appealing way is essential.
For just $0.99, you can download this slide instantly and edit it in PowerPoint or Google Slides. Tailor the visuals to align with your financial narrative and make an impression in minutes.
$0.99 – Purchase Checkout
Added to cart