Illustrate Financial Strategies with Growth Infographics

Product Description
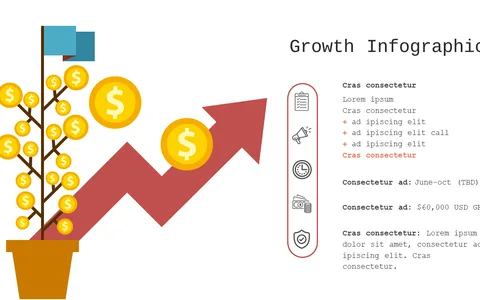
Finding a way to illustrate financial growth strategies can often feel overwhelming, especially with complex data to present. This slide features an engaging infographic that visually breaks down growth concepts using recognizable icons, allowing your audience to absorb information effortlessly.
Financial analysts and budget managers will benefit greatly from using this slide in quarterly reviews or investment proposals. It’s perfect for meetings where you need to communicate financial projections and strategic initiatives clearly to your team or clients.
For only $0.99, you can download this slide instantly, and it’s easily editable in PowerPoint and Google Slides. You’ll be able to customize it to fit your specific needs in just a few minutes, making your financial presentations clearer and more impactful.
$0.99 – Purchase Checkout
Added to cart