Present Investment Strategies with Growth Elements
Product Description
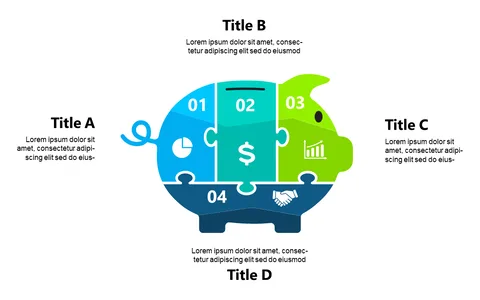
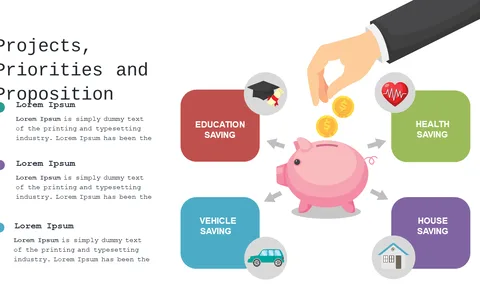
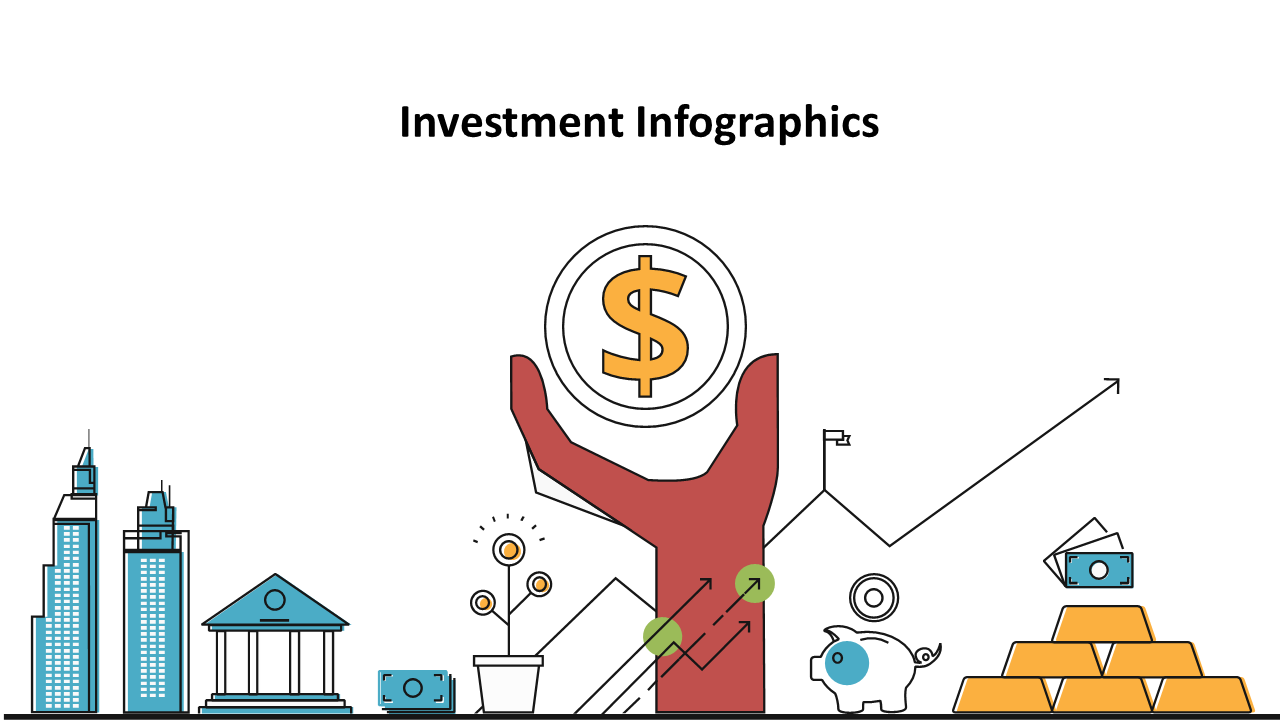
Presenting investment strategies can be challenging, especially when trying to convey complex concepts in an engaging manner. This slide offers a visually captivating representation with a hand holding a dollar sign, surrounded by growth elements, to capture your audience’s attention and simplify your message.
Whether you’re a financial analyst presenting to clients or an investment manager leading a team meeting, this slide is perfect for explaining intricate ideas. It supports discussions during strategy sessions, investment reviews, or educational workshops focused on financial literacy and investment planning.
Available for just $0.99, this slide can be downloaded instantly and is ready to use. It’s fully customizable in PowerPoint and Google Slides, so you can tailor it to fit your presentation style in just a few clicks.
$0.99 – Purchase Checkout
Added to cart