Visualize Financial States with Break-Even Graph
Product Description
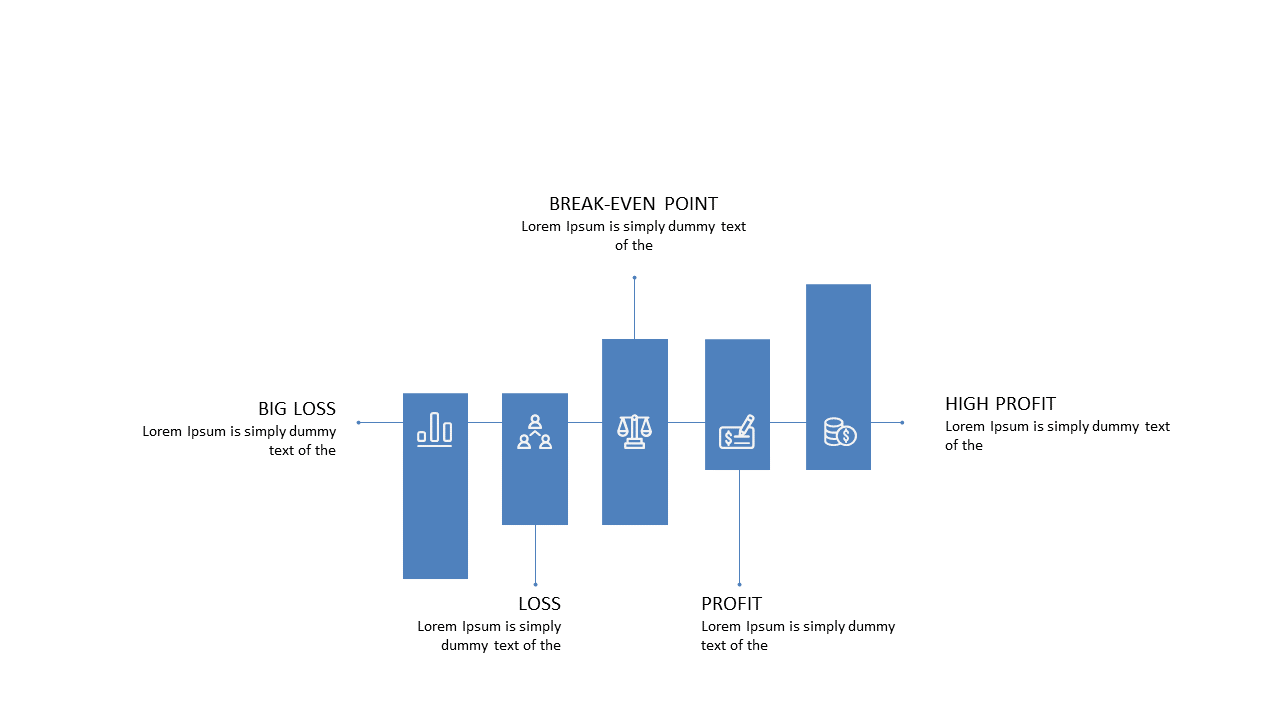
In the fast-paced world of finance, clearly conveying complex data can be a real challenge. This slide features a visually appealing break-even graph that illustrates various financial states, including profit and loss points, in an intuitive way.
It arms you with the ability to share critical financial insights without losing your audience in numbers. You’ll find this slide especially useful when presenting quarterly results as a financial analyst, or when budget discussions arise in operational meetings among team leaders. It can also be invaluable during investor meetings where clear financial forecasts are essential for gaining support and backing.
For just $0.99, you can download this engaging slide instantly and edit it in PowerPoint or Google Slides. Its easy customization means you can tailor the data and design to present your unique financial story in mere minutes.
$0.99 – Purchase Checkout
Added to cart