Colorful Horizontal Timeline for Milestones

Product Description
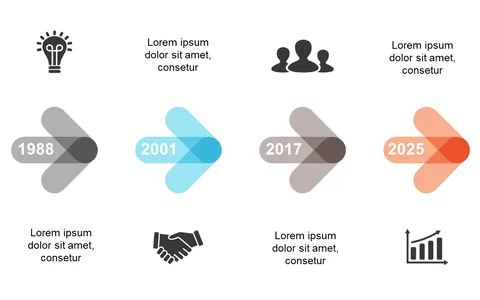
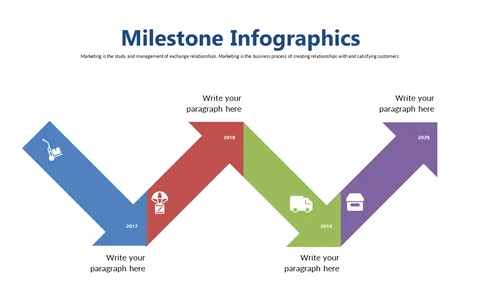
Conveying your project milestones can become complex and overwhelming when there are multiple achievements to share. This colorful horizontal timeline simplifies that task by visually mapping out your key milestones alongside descriptive text, making it easy for your audience to follow your progress at a glance.
Use this slide if you’re a project coordinator or program manager presenting to your team, executives, or even clients during progress updates or project reviews. It’s a great tool for visually communicating your accomplishments and the timeline of your projects.
For just $0.99, you can download this slide instantly and customize it to fit your project’s needs. It works seamlessly in both PowerPoint and Google Slides, allowing for quick edits and additions before your next presentation.
$0.99 – Purchase Checkout
Added to cart