Present Mask Delivery Data with Engaging Infographic
Product Description
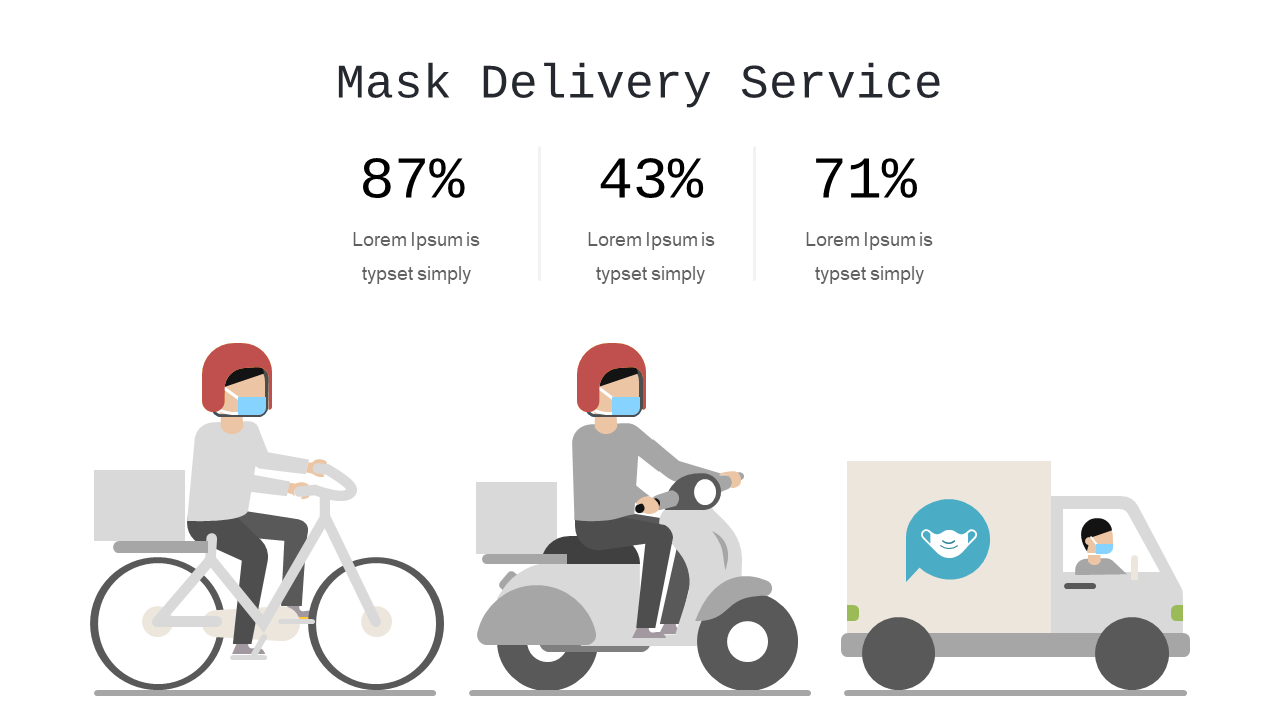
In our data-driven world, making information easy to understand is crucial, yet it can be tough to achieve in a compelling way. This infographic slide stands out by showcasing a vibrant depiction of characters involved in a mask delivery service, paired with key statistics that grab attention and facilitate comprehension.
Public health officials, marketing analysts, and event coordinators tasked with reporting on health initiatives will find this slide particularly useful. Whether you’re presenting at a community meeting, a corporate health briefing, or a public health seminar, this design will help convey your message clearly and effectively.
Available for just $0.99, this engaging slide can be downloaded instantly and edited in PowerPoint or Google Slides to fit your specific needs. You’ll have everything ready to present in no time.
$0.99 – Purchase Checkout
Added to cart







