Visualize 7 Steps in Business Strategies

Product Description
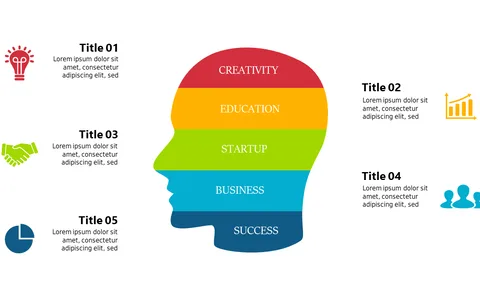
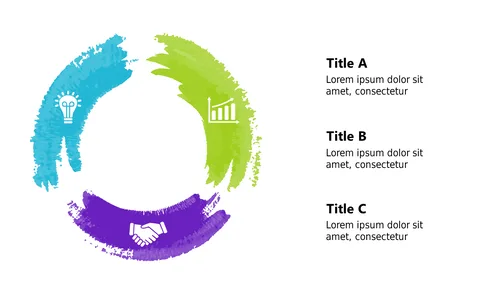
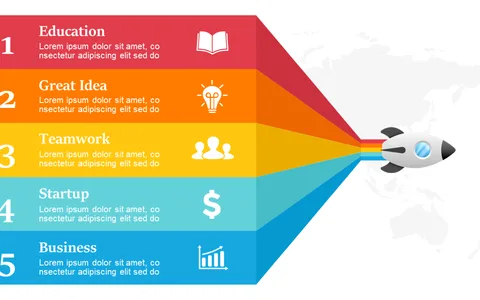
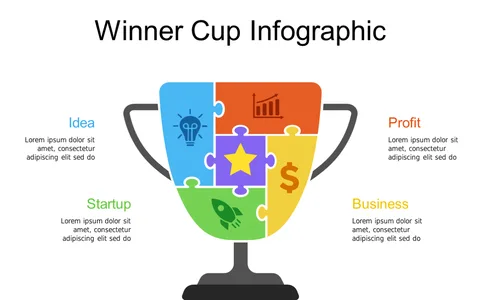
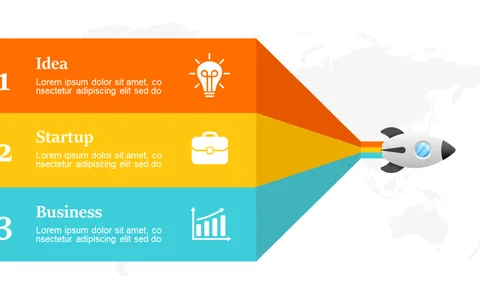
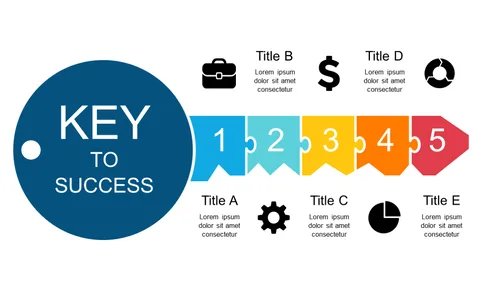
When pressed for time to communicate complex strategies, a visual aid can be a game-changer. This infographic clearly visualizes a 7-step circular process, helping your audience to quickly comprehend the strategy at hand.
Strategic planners defining business goals, marketing teams outlining campaign processes, or finance professionals detailing budget steps will find this slide immensely helpful.
It’s perfect for strategy sessions, quarterly meetings, or any scenario where you need to present a clear plan of action. At just $0.99, this slide is available for instant download and can be edited in PowerPoint or Google Slides, so you can get started right away.
$0.99 – Purchase Checkout
Added to cart
✅ Instant delivery
✅ Fully editable
✅ PowerPoint & Google Slides
Category:
$0.99
Per slide · No minimum · Pay only for what you pick
✓ $0.99/slide
No minimum order
✓ Mix any category
No subscription
Building a full deck?
Mix slides from any of our 58 categories —
all merged into one PowerPoint.
$0.99/slide, no minimum.
Browse All Slides →