Visualize Relationships with Circular Diagrams
Product Description
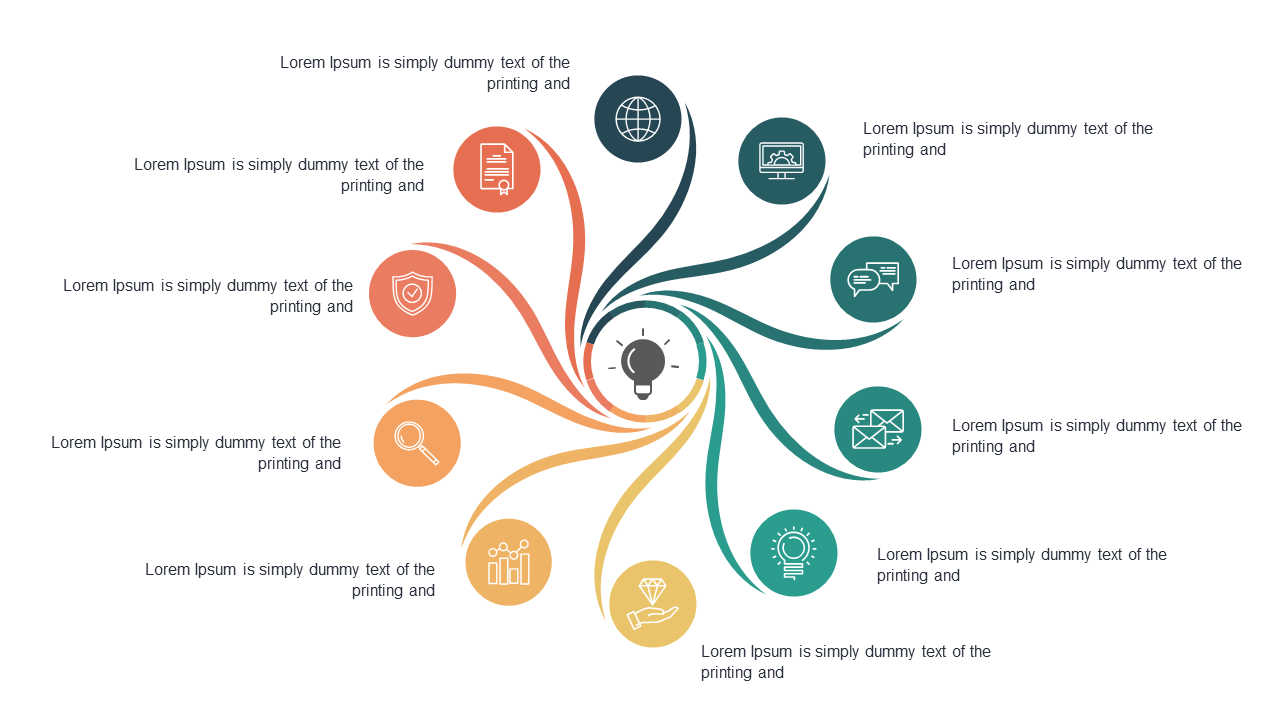
Conveying intricate relationships can be a daunting task, and losing your audience’s focus is far too easy. This circular diagram slide offers a clear visual representation to help you explain multiple interrelated ideas without overwhelming your listeners.
It’s designed to keep attention while providing necessary clarity. Ideal for roles like business analysts mapping out project dependencies or educators explaining curriculum connections, this slide is perfect for various settings. Use it during team meetings, training sessions, or lectures to create a stronger understanding of complex information.
Download this engaging slide for only $0.99, and take your presentations to the next level. It’s fully editable in PowerPoint and Google Slides, making customization a breeze and allowing you to prepare in just minutes.
$0.99 – Purchase Checkout
Added to cart







