Present Statistical Data with Radial Diagrams
Product Description
When you’re trying to present statistical data, engaging your audience is paramount. If numbers often fall flat in your presentations, a dynamic visual can bring them to life.
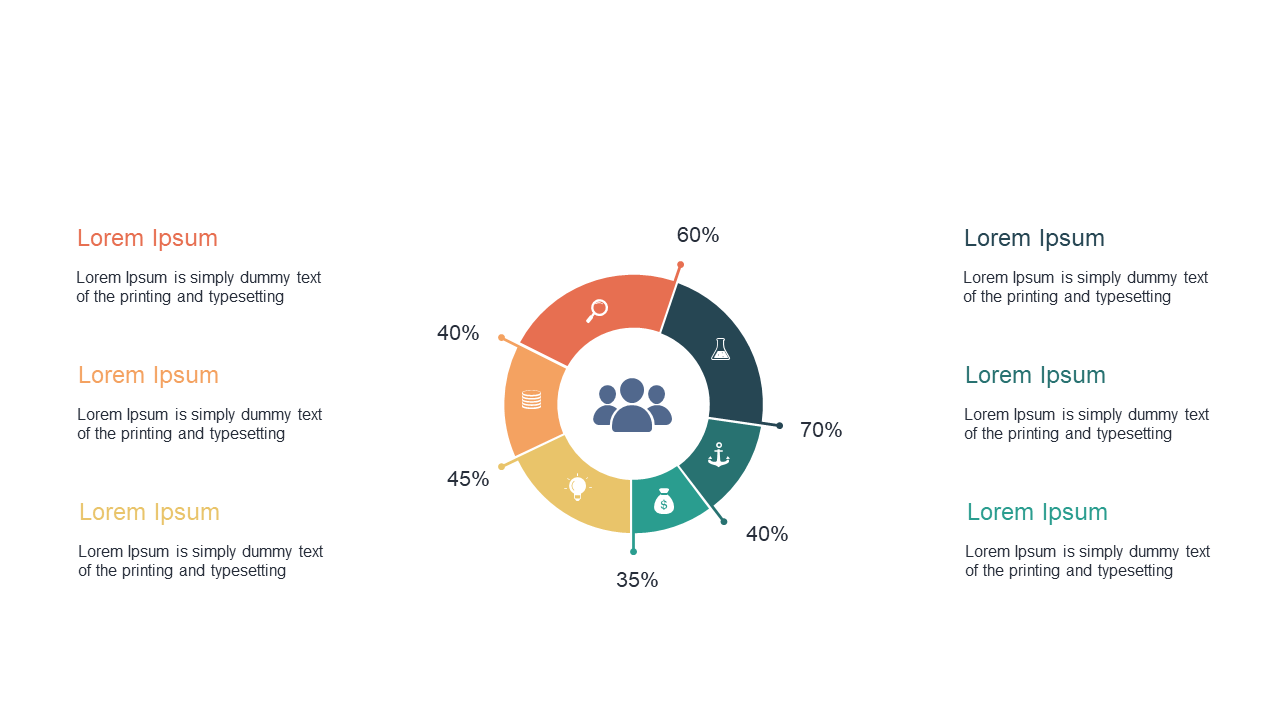
This radial diagram slide transforms ordinary statistics into a vibrant visual narrative, making it easier for your audience to grasp what the data really means. Use this slide when you’re a data analyst presenting findings to your team or a sales manager discussing performance metrics in a quarterly review. It’s also useful for educators aiming to make complex data relatable during lectures, fostering a deeper understanding among students.
You can own this slide for just $0.99, and it’s available for immediate download. It’s easy to edit in both PowerPoint and Google Slides, allowing you to customize it to suit your presentation needs quickly.
$0.99 – Purchase Checkout
Added to cart







