Present Financial Insights with Engaging Visuals

Product Description
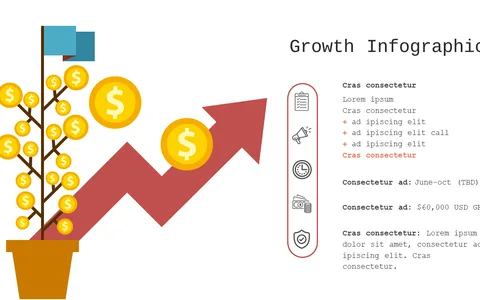
Making financial insights captivating can often feel like a daunting task, especially when numbers dominate the conversation. This engaging slide layout is designed to present financial metrics visually, using symbols like dollar coins and upward arrows to represent growth.
It captures attention while delivering essential insights effectively. This visual is perfect for finance professionals presenting quarterly reports or business analysts discussing budget forecasts. It can also be used by investment advisors explaining trends in portfolio performance or entrepreneurs outlining revenue projections to potential investors.
You can grab this impactful slide for just $0.99, and it’s available for instant download and easy editing in PowerPoint or Google Slides. Make your financial insights shine in your next presentation!
$0.99 – Purchase Checkout
Added to cart