Present Data with Radial Chart Infographic
Product Description
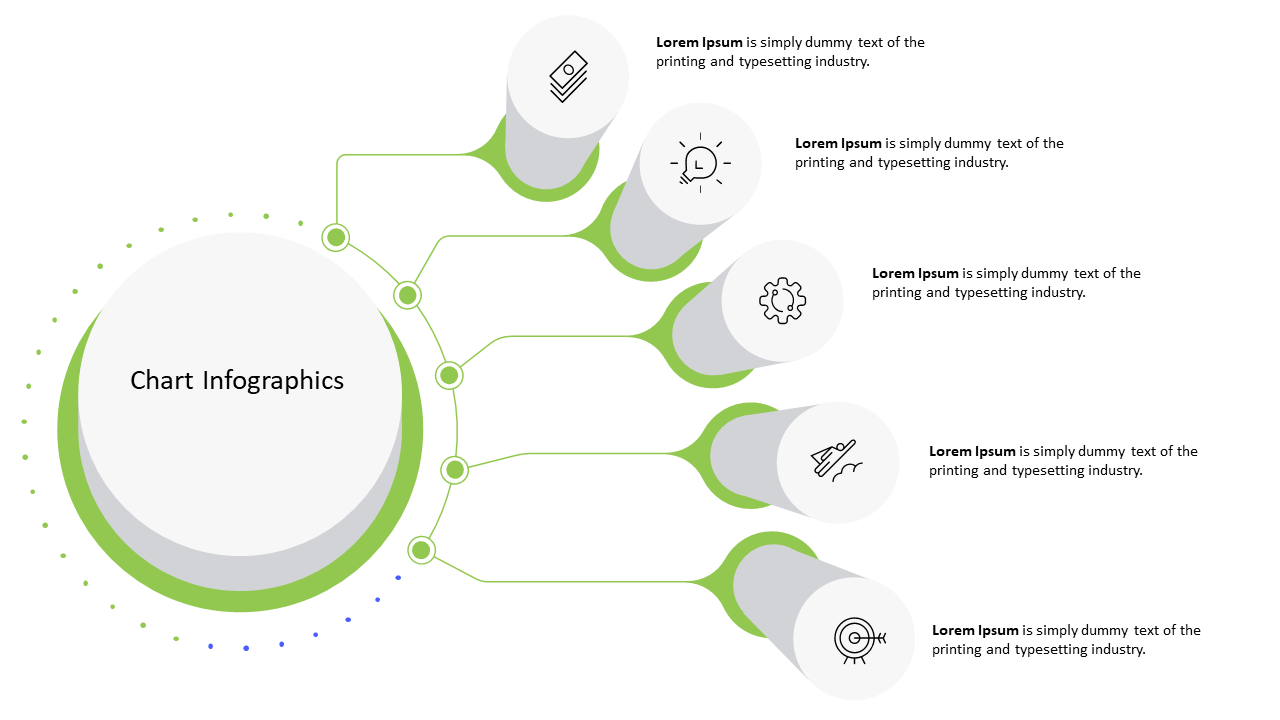
Conveying data can feel like an uphill battle when you’re faced with dense statistics and complex visuals. This radial chart infographic transforms that challenge into an engaging opportunity, allowing you to highlight key points with eye-catching clarity.
Its unique design ensures your audience stays focused and retains the information presented. Sales executives in the tech industry can benefit greatly from using this slide during quarterly performance reviews, while data analysts can showcase market trends to their teams. Marketing professionals might find it ideal for client presentations, ensuring that essential metrics stand out and drive discussions.
For just $0.99, you can download this slide instantly and make it your own, easily editing it in PowerPoint or Google Slides. It’s a straightforward solution that can enhance your presentations within minutes.
$0.99 – Purchase Checkout
Added to cart







