Summarize Ideas with Light Bulb Infographic Layout

Product Description
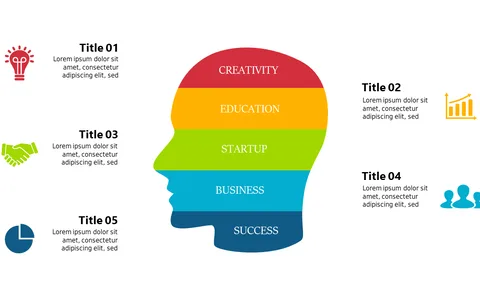
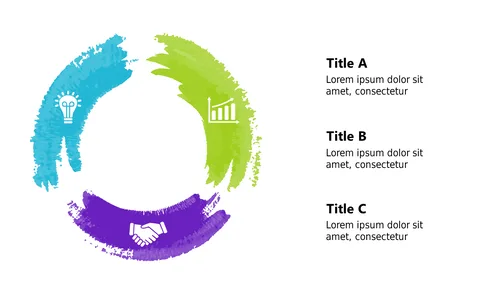
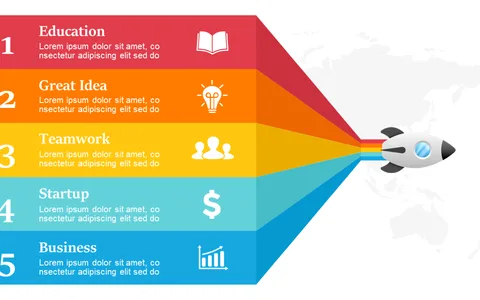
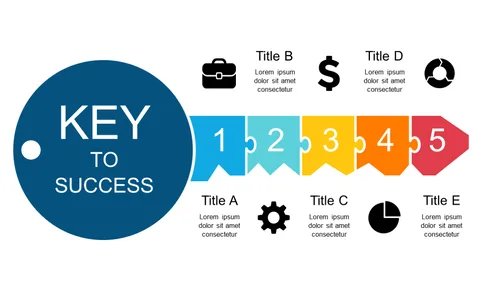
Summarizing multiple concepts in a single slide can often feel overwhelming, leading to confusion instead of clarity. With this light bulb infographic layout, you get a vibrant and inviting design that draws attention and simplifies your ideas into digestible pieces.
It’s the visual punch your presentations need. This slide works wonders for educators summarizing class discussions, business professionals wrapping up quarterly reviews, or consultants presenting client solutions. Whether you’re in a team meeting, a pitch session, or a training workshop, it’s a versatile tool to summarize ideas effectively.
For just $0.99, this slide is available for instant download and is fully editable in both PowerPoint and Google Slides. You can personalize it in no time, ensuring you’re ready for your next presentation without any fuss.
$0.99 – Purchase Checkout
Added to cart