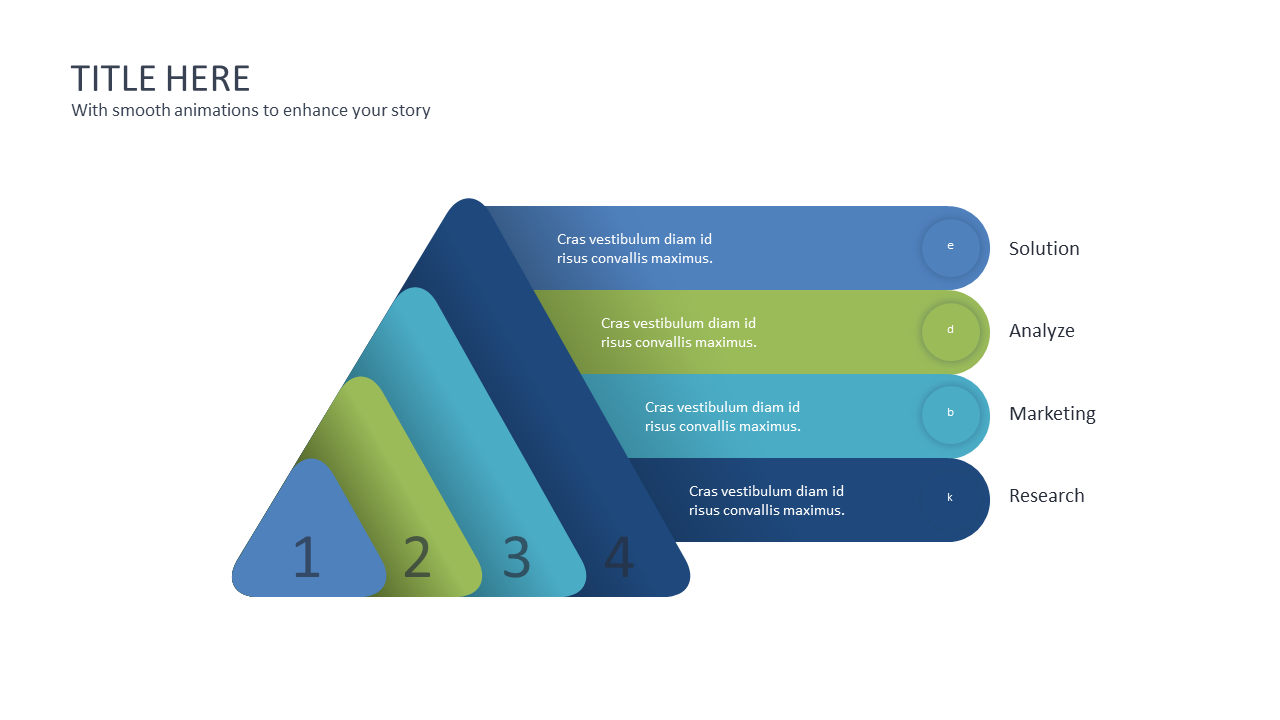
Present Hierarchical Data with Step Pyramid Layout
Product Description
Navigating complex hierarchical data can often feel like trying to untangle a web. This step pyramid layout simplifies that challenge by clearly illustrating different levels of information, making it easier for your audience to grasp relationships and structure.
It’s a practical tool to clarify your message without unnecessary confusion. This slide suits business analysts, project coordinators, and anyone in a role that requires presenting layered information. Use it during strategy sessions, training modules, or executive briefings to clearly convey how various components relate to each other in your data.
At just $0.99, this slide is ready for you to download and customize right away, whether you’re working in PowerPoint or Google Slides. Edit it in minutes to match your presentation style and content.
$0.99 – Purchase Checkout
Added to cart







