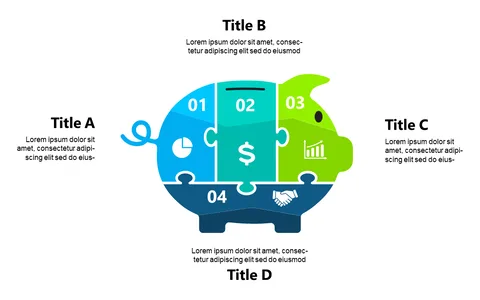
Visualize Budget Allocation with Piggy Bank Diagram
Product Description
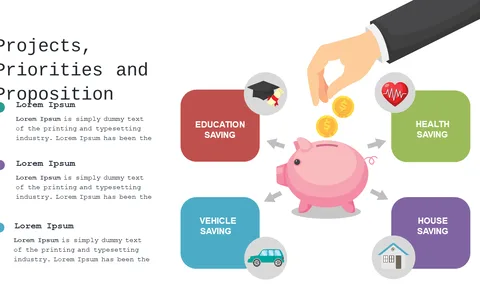
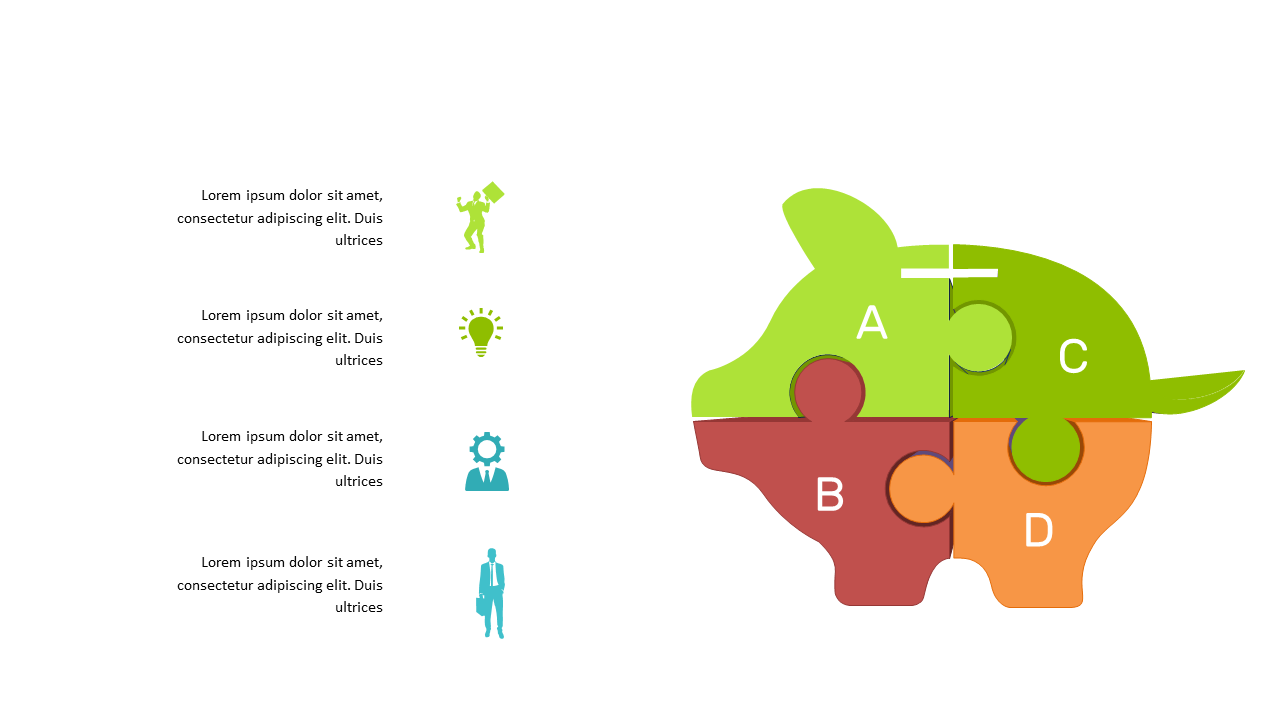
Trying to communicate budget allocations can often feel like deciphering a complex code—your audience may struggle to see the bigger picture. With this piggy bank diagram, you can simplify those financial strategies and present clear visual segments that make sense at a glance. It’s a tool that can transform confusing numbers into an engaging narrative.
This slide is perfect for finance managers during budget review meetings, CFOs discussing fiscal strategies, or project leads presenting funding requests. You can use it in team discussions, board meetings, or even workshops, ensuring everyone understands where the money is going and why it matters.
The clearer you communicate your budget, the more informed your audience will feel. For just $0.99, you can instantly download this slide and make it your own. It’s easy to edit in both PowerPoint and Google Slides, allowing you to customize it to suit your specific needs in minutes.
$0.99 – Purchase Checkout
Added to cart